
The price of Ethereum (ETH) has seen extreme volatility in recent months, leaving investors to grapple with conflicting expert opinions on where the asset may be headed next. To gain clarity in these uncertain times, it helps to examine the issue from multiple angles.
In the Ethereum community, two particularly prominent voices have emerged with divergent views – renowned analyst Ali (@ali_charts) who is cautious in the short-term, and trader Miles Deutscher (@milesdeutscher) who remains bullish long-term.
By understanding their unique perspectives, investors can make more informed decisions about the cryptocurrency’s future prospects. This article will summarize Ali and Miles’ key insights, analyze the current technical indicators, and attempt to reconcile these differing market narratives to chart a wise course forward for ETH investors.
What you'll learn 👉
The Whale Effect: A Short-Term Perspective by Ali (@ali_charts)
Ali, a famous Twitter analyst and technical analysis expert, pointed out a strong correlation between the number of Ethereum whales holding 10,000+ $ETH and the cryptocurrency’s price trajectory. According to Ali, if seasoned investors are offloading their holdings, it raises an important question: Is now the right time to buy or to short Ethereum?
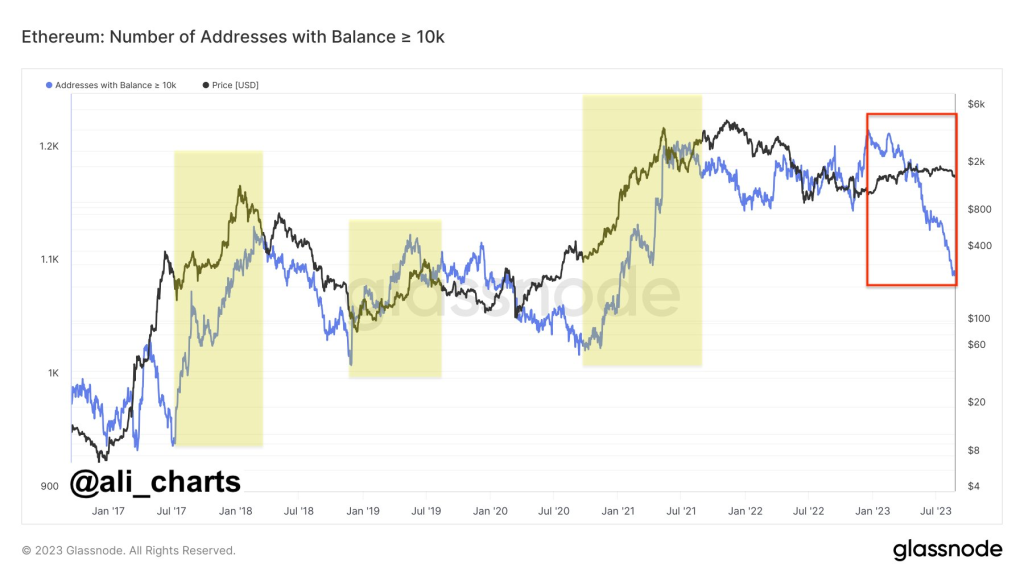
Ali has taken a cautious approach by opening a short position on Ethereum through @STFX_IO. His strategy is to watch the movements of these whales closely before making any long-term investment in $ETH. “If smart money is selling #Ethereum, why shouldn’t I?” Ali questions, emphasizing the importance of following the lead of large investors.
The Network Effect: A Long-Term Perspective by Miles Deutscher (@milesdeutscher)
On the other hand, Miles Deutscher, a well-known trader and crypto analyst, offers a more optimistic view. Despite the bear market, he notes that the Ethereum ecosystem continues to expand rapidly. The number of active addresses across Layer 1 and Layer 2 solutions has reached an all-time high of 1.97 million.
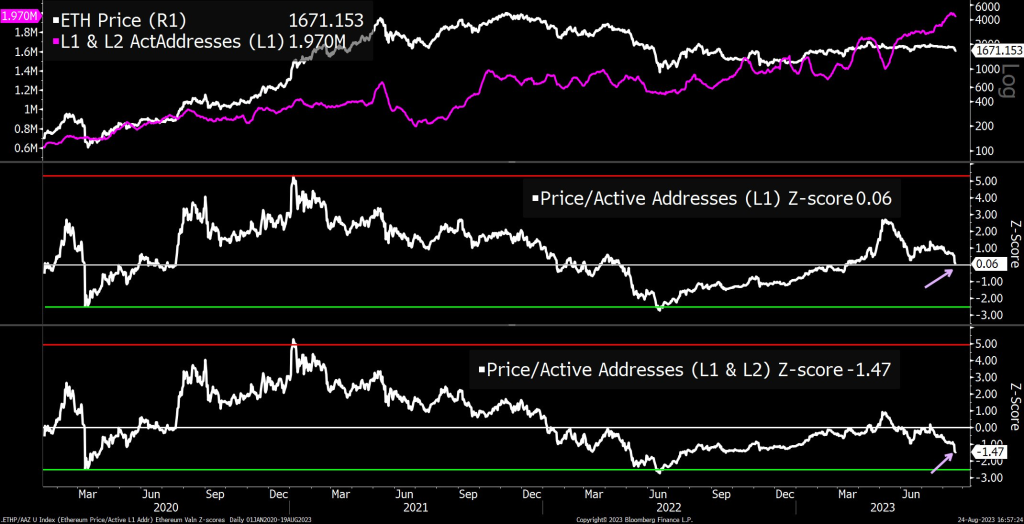
Miles emphasizes the concept of “network effect,” defined as a phenomenon where the value of a good or service increases with the number of users. In the context of Ethereum, more users equate to more value. Miles believes that aside from the typical growth drivers like hype and speculation, the network effect will be the underlying factor driving Ethereum’s long-term growth.
He also cites an analysis by Jamie Coutts (@Jamie1Coutts), an analyst at Business Insider, who suggests that Ethereum is undervalued when considering its exploding Layer 2 solutions. According to Coutts, the network appears undervalued at -1.47 standard deviations based on active addresses.
The contrasting views of Ali and Miles Deutscher provide a comprehensive understanding of Ethereum’s current market dynamics. While Ali’s short-term caution is influenced by whale activity, Miles offers a long-term perspective based on the growing network effect. Both approaches have their merits, and investors may benefit from considering these insights when making their investment decisions in Ethereum.
Ethereum Price Analysis: A Technical Perspective
In addition to the market dynamics and investor behavior discussed earlier, it’s crucial to consider the technical indicators that are currently shaping Ethereum’s price action. Here’s a breakdown of the key technical aspects to consider:
Bearish Breakout and Support Levels
Ethereum recently experienced a bearish breakout from a Rising Wedge pattern, which is generally considered a bearish reversal pattern. Following this, the price also broke below the critical support area of $1,800 and the 200-day Moving Average (MA). This development puts the ongoing uptrend at risk and shifts the immediate trend to bearish.
Oversold Conditions and Potential Bounce
In the near term, the Relative Strength Index (RSI) indicates that the asset is very oversold, with an RSI value of around 22. This suggests that we’re likely to see a bounce in the near term. If the price manages to regain its position above the 200-day MA, it could signal the resumption of the uptrend. Investors should consider setting a price alert for this level.
The trend for Ethereum is bearish across all time horizons—short, medium, and long-term. This is a crucial factor to consider for both swing traders and long-term investors.
Momentum Indicators
The Moving Average Convergence Divergence (MACD) line is currently below the MACD Signal Line, indicating bearish momentum. However, the MACD Histogram bars are rising, suggesting that the bearish momentum may have bottomed out and could be nearing another upswing.
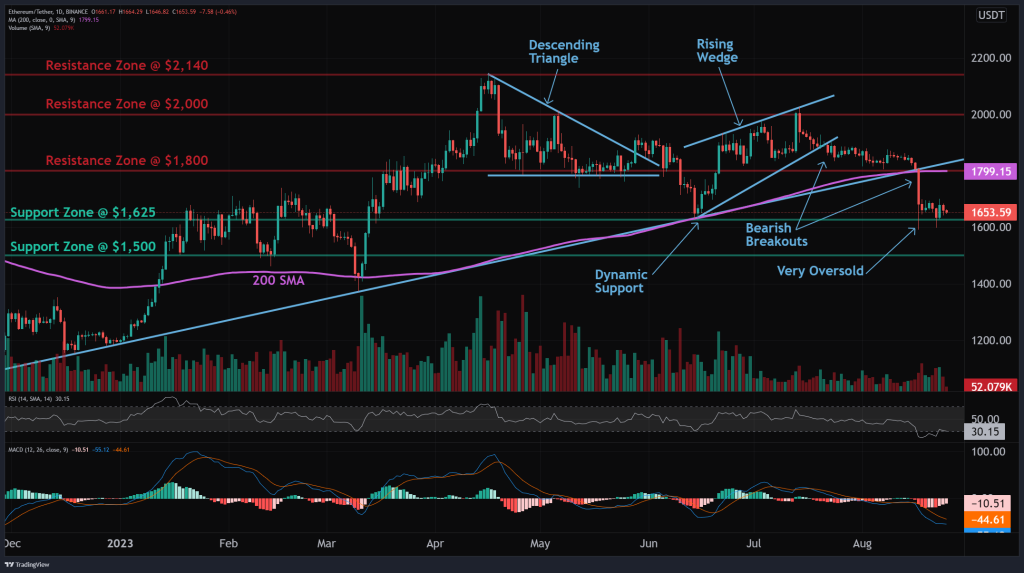
Source: altFINS – Start using it today
Support and Resistance Zones
- Nearest Support Zones: The immediate support level to watch is at $1,625, followed by $1,500.
- Nearest Resistance Zones: On the upside, the first resistance is at $1,800, which was the previous support level. This is followed by resistance levels at $2,000 and $2,140.
We recommend eToro
Wide range of assets: cryptocurrencies alongside other investment products such as stocks and ETFs.
Copy trading: allows users to copy the trades of leading traders, for free.
User-friendly: eToro’s web-based platform and mobile app are user-friendly and easy to navigate.


