After weeks of trading in a tight range between $0.343 and $0.520, Stellar price is starting to look like it could be gearing up for something bigger. Many eyes are now locked on this zone, as it may serve as the launchpad for a rally that pushes XLM closer to $1.
Ali, an analyst on X with over 150,000 followers, hinted at this exact possibility. He pointed out that this price range is not just random noise, it could be the sweet spot where accumulation happens before a strong breakout.
What you'll learn 👉
What Makes Stellar Stand Out?
Stellar has long positioned itself as a blockchain built for fast, low-cost cross-border payments, but the chart itself is what’s turning heads at the moment. Consolidation around a key level often sets the stage for big moves, and right now the Stellar price is doing just that.
Think of it like a spring being compressed. The longer it stays tight, the more powerful the release could be once momentum kicks in. Ali’s observation that this zone could be a “perfect buy zone” adds weight to the idea that something significant might be brewing.
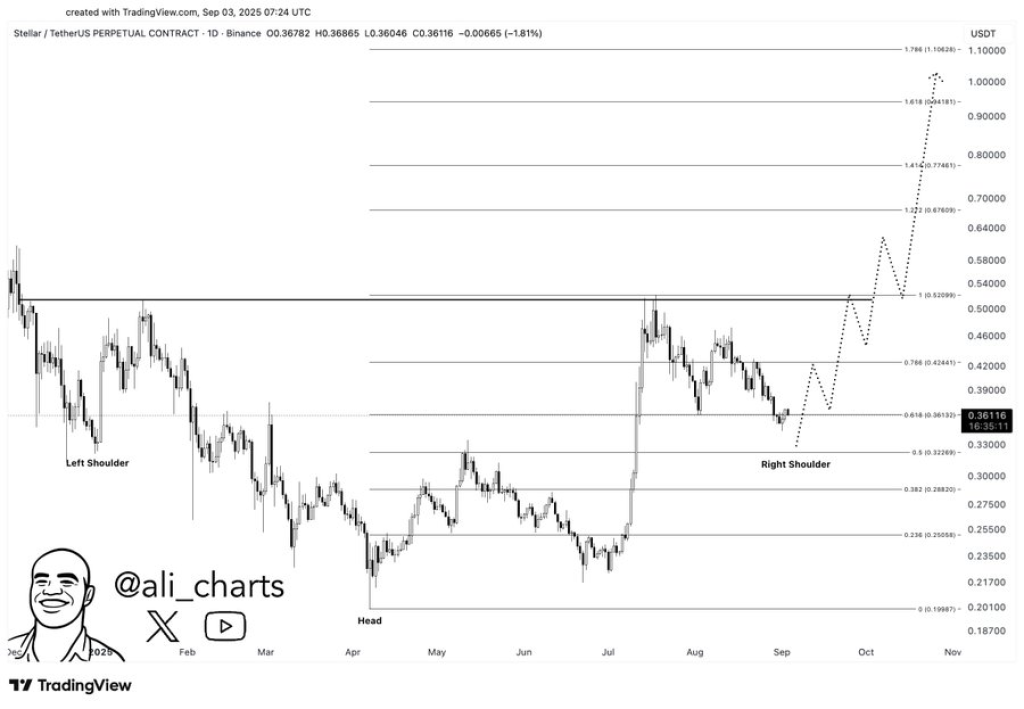
Ali’s chart shows a clear inverse head-and-shoulders pattern, a classic reversal signal. On the left, XLM formed a shoulder during its earlier dip. Then it dropped lower into a head around April before bouncing back. More recently, the right shoulder has taken shape near $0.36.
This pattern suggests that Stellar price might be finishing its downtrend and preparing for an upside move. If the neckline sitting close to $0.50 breaks, history shows that these setups often lead to strong rallies. Traders view this as one of the more reliable signals in technical analysis.
What the Fibonacci Lines Reveal
Ali also applied Fibonacci retracement and extension levels to map potential targets. These lines aren’t random; they’re based on ratios seen repeatedly in financial markets, almost like natural patterns.
From the chart, the breakout level near $0.50 aligns with a key retracement zone. If XLM clears it, Fibonacci projections point toward $0.70, $0.80, and eventually $1 as possible resistance points. These aren’t guarantees, but they provide a roadmap of where Stellar price might pause or accelerate if momentum builds.
Imagine climbing stairs in the dark. You don’t know how many steps there are, but the Fibonacci lines give you markers so you can expect when the next step might show up. That’s what traders use to anticipate turning points in price action.
Why This Could Be the Perfect Buy Zone!
What makes this potential breakout interesting is the combination of factors. Stellar is not just sitting at a random price level. It’s consolidating in a zone identified by both a strong technical pattern and Fibonacci alignment. Add to that the growing attention from analysts like Ali, and the setup feels less like noise and more like a coordinated structure forming.
Other coins have had similar moments before their big moves. Solana once traded quietly around $0.50 before exploding to double digits. While no two charts are the same, the parallel makes some traders wonder if Stellar could be on a similar path.
Read Also: September Setup: Here’s What to Expect from Ripple (XRP) Price in the Coming Weeks
Stellar’s current price action is sparking curiosity, and the chart from Ali offers a compelling case for why this zone matters. With an inverse head-and-shoulders setup, Fibonacci targets stretching toward $1, and consolidation hinting at a build-up, the XLM price is sitting at an intriguing crossroads.
Subscribe to our YouTube channel for daily crypto updates, market insights, and expert analysis.