What if you knew the exact point to jump back into a token before it doubles? That’s the opportunity one analyst believes could be forming for Sui right now. After months of sideways action, the chart is beginning to flash signals of strength.
According to Ali, who shared his analysis on X, SUI may be entering a zone where the next reload could set the stage for a move toward $7.
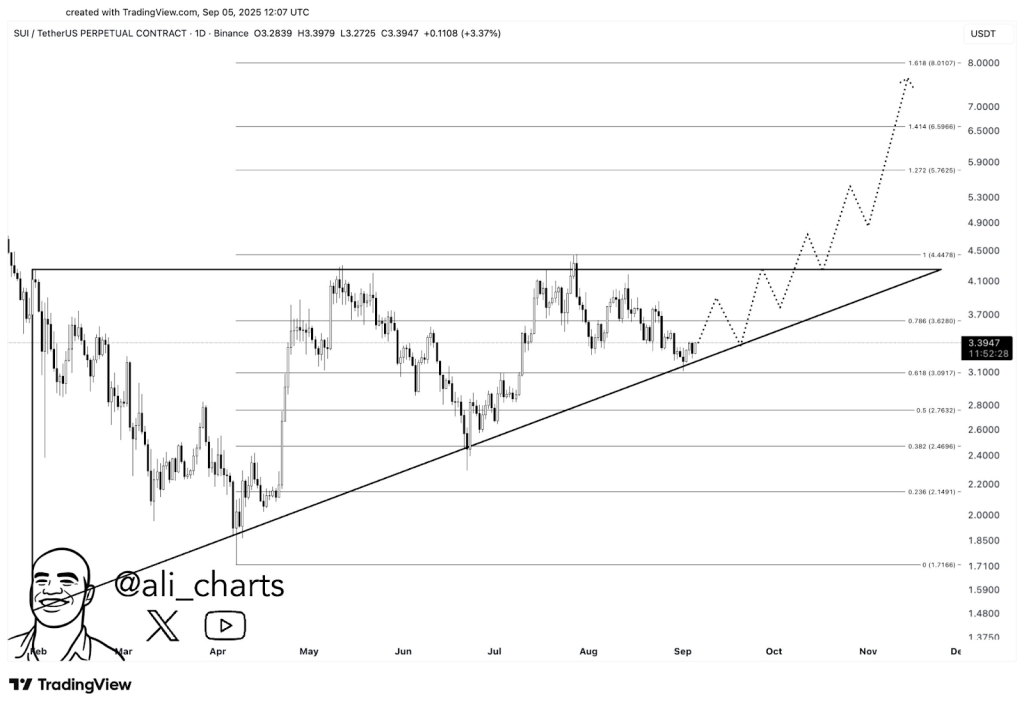
SUI price has been grinding along an ascending trendline that started building in March. Every pullback since then has respected this rising base, suggesting that buyers are quietly stepping in at higher lows.
Right now, Sui is trading near $3.39, sitting close to the 0.786 Fibonacci retracement level around $3.62. Ali’s chart noted this zone as a critical area, where a bounce could lay the foundation for a stronger rally.
If SUI price holds here, the next major resistance sits at around $4.45, a level that has capped moves multiple times in the past. Breaking above that line would not just be a breakout, it would confirm months of coiling energy, with the possibility of releasing into a much larger move.
Breaking Down Ali’s Fibonacci Levels
Ali’s chart doesn’t just stop at the next resistance. It maps out potential upside targets using Fibonacci extensions, which often act like roadmaps for how far a trend can stretch. The first major Fibonacci target sits at $5.76, which represents the 1.272 extension. From there, the 1.414 extension at $6.59 and the 1.618 extension at $8.01 show where SUI price could realistically travel if momentum accelerates.
These levels are not random lines. Think of them as checkpoints where traders typically take profit or reassess positions. The fact that Ali projects a potential path toward $7 suggests he sees strength in the structure that many may be overlooking.
Consolidation can be frustrating, especially for those holding Sui through months of sideways chop. Yet charts like this often remind long-term investors of similar setups in other tokens before they broke out.
Some compare it to how Solana built a base before its explosive rallies in past cycles. SUI price has been squeezing between higher lows and a stubborn ceiling at $4.45, and history shows that such patterns often resolve with sharp moves.
What to Watch Next for SUI
The question now is whether Sui can stay above the $3.10 to $3.60 range and build momentum toward that $4.45 breakout. If it does, Ali’s chart gives a clear roadmap of where the token could head next. Traders and investors eyeing SUI will likely keep a close watch on how price reacts in this tight zone, because this may be the exact “load-up spot” before the market tries for a 2x move.
Read Also: Ripple Co-Founder Offloads Millions in XRP – Should Holders Worry?
Sui has spent most of the year building pressure, and Ali’s analysis points to a moment where that pressure could finally release. Whether SUI price takes the path toward $7 or stalls once more at resistance, the coming weeks look critical. The chart tells a story of coiling energy waiting to break.
Subscribe to our YouTube channel for daily crypto updates, market insights, and expert analysis.