Ethereum (ETH) has been on a steady upward trajectory, with its price recently breaking above the crucial $4,000 resistance level. As the crypto market continues to recover from the prolonged bear market, analysts and traders are closely monitoring Ethereum’s price action, with many anticipating a potential move towards the $5,000 mark.
What you'll learn 👉
Thinning Resistance and Key Supply Zone
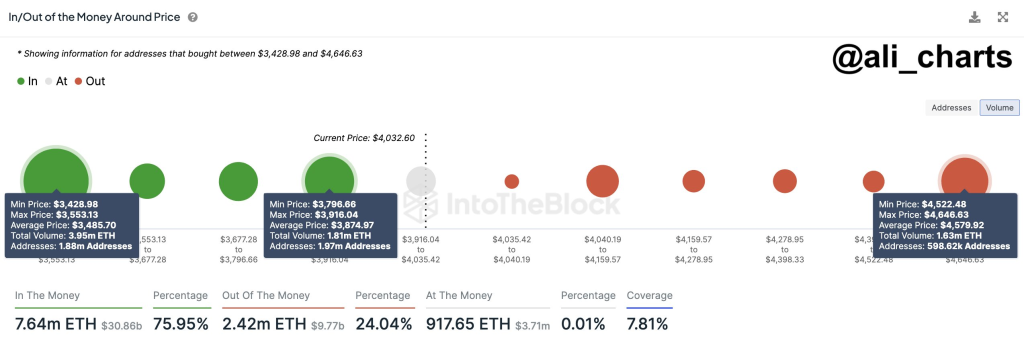
Trader Ali has observed that Ethereum’s path to $5,000 is becoming increasingly clear as resistance levels thin out. However, the key hurdle that ETH must overcome is a supply zone located between $4,522 and $4,646, where approximately 600,000 addresses hold a combined 1.63 million ETH.
This supply zone represents a significant level of potential selling pressure, as holders who bought ETH within this price range may be tempted to take profits or break even as the price approaches their entry points. Ali believes that it is not a question of if Ethereum will break through this supply zone, but rather a matter of when.

Technical Analysis Indicates Bullish Momentum
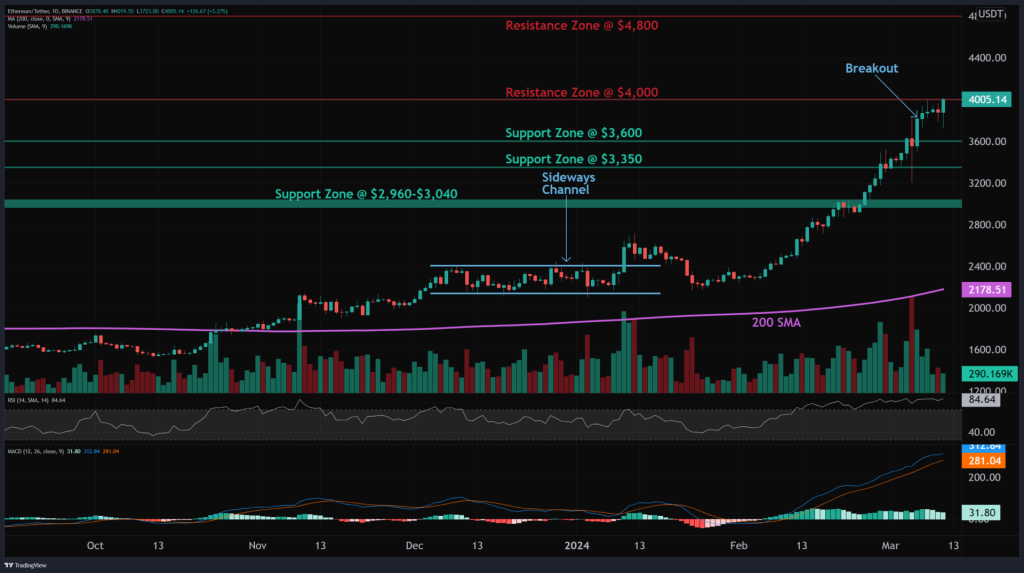
Technical analysis platform altFINS has issued a bullish outlook for Ethereum in the near term, citing a resistance breakout pattern that has reached the breakout stage. The platform highlights ETH’s recent break above the $4,000 resistance level, which signals a continuation of the prevailing uptrend.
altFINS projects a potential 20% upside for Ethereum, targeting its all-time high (ATH) of $4,860. The platform suggests setting a stop loss (SL) level at $3,570 to manage risk and protect against potential downside.
Furthermore, altFINS notes that Ethereum is likely to benefit from the upcoming launch of the Ethereum Spot ETF in May 2024. This development is expected to drive increased institutional interest and investment in ETH, potentially boosting its price further.

Source: altFINS – Start using it today
Uptrend Across All Time Horizons
Ethereum’s price action remains in an uptrend across all time horizons, including short-, medium-, and long-term perspectives. This indicates strong bullish sentiment and suggests that the current upward momentum may be sustainable in the coming weeks and months.
However, altFINS also notes that while Ethereum’s momentum is currently bullish, there are signs of inflection. The MACD line is above the MACD signal line, and the RSI is above 55, both of which are bullish indicators. However, the MACD histogram bars are declining, suggesting that momentum may be weakening.
Doge2014 raises 500K in days celebrating Dogecoin. Make potentially big profits and get in on exclusive airdrop!
Show more +Support and Resistance Levels to Watch
As Ethereum continues its upward journey, traders and investors should keep a close eye on key support and resistance levels. The nearest support zone for ETH is located at $3,600, which previously acted as resistance. Below that, the next support level lies at $3,350.
On the upside, the nearest resistance zone was located at $4,000, which Ethereum has recently broken above. The next significant resistance level is found at $4,800, which aligns closely with the all-time high of $4,860.
Ethereum’s potential path to $5,000 is becoming increasingly plausible as resistance levels thin out and bullish momentum continues to build. However, the key supply zone between $4,522 and $4,646 remains a significant hurdle that ETH must overcome to maintain its upward trajectory.
We recommend eToro
Wide range of assets: cryptocurrencies alongside other investment products such as stocks and ETFs.
Copy trading: allows users to copy the trades of leading traders, for free.
User-friendly: eToro’s web-based platform and mobile app are user-friendly and easy to navigate.


