
Ethereum is still stuck in a tight range at $2,486.93 – $2,547.50 after losing momentum earlier this month.
With momentum clearing and big moves from buyers, price action looks uncertain. Most short-term indicators are mixed, while ETH stays capped under key resistance and above soft support.
After peaking near $2,800 earlier in June, ETH price has steadily formed lower highs. It now sits just above the $2,500 mark, unable to reclaim the 9-day moving average.
Let’s take a closer look at today’s setup.
What you'll learn 👉
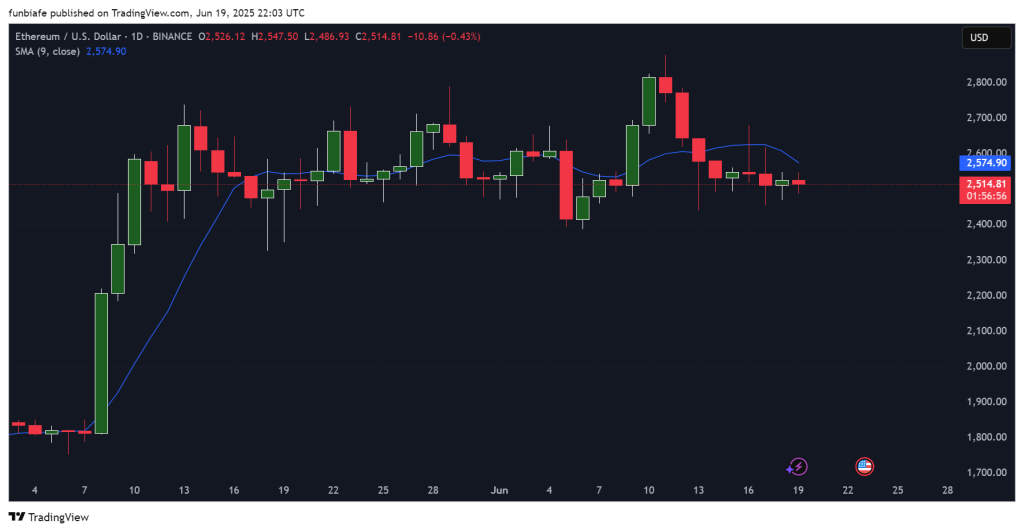
📊 Ethereum Daily Overview (June 20)
- Current Price: $2,514.8124h
- Change: -0.43%
- SMA (9): $2,574.90
- Volume: Low and stagnant
ETH price continues to move between $2,480 and $2,575, with no signs of breakout or breakdown. The 9-day SMA is acting as resistance, and buyers have not managed to regain control. Recent candles are small-bodied, also reflecting indecision and weak participation.
🔍 What the Ethereum Chart Is Showing
The ETH chart shows a soft downtrend. Price has been printing lower highs since the last peak, and each attempt to move higher has been rejected near the 9-day SMA.
Support at $2,480–$2,500 has been held for several sessions. A breakdown below this zone could lead to a move toward $2,350 or even $2,200.
Resistance sits at $2,575, with further barriers at $2,700 and $2,800. ETH needs to close above $2,600 to get the short-term momentum back on the bulls’ side.
📈 Technical Indicators (Daily Timeframe)
| Indicator | Value | Signal / Interpretation |
| MACD (12,26) | -3.23 | Bearish momentum, sell signal |
| ADX (14) | 32.31 | Trend strength building, buy signal |
| CCI (14) | 1.1651 | Flat momentum, neutral |
| RSI (14) | 50.85 | Balanced, no dominant side |
| Ultimate Oscillator | 42.61 | Leaning bearish |
| Bull/Bear Power (13) | 8.3078 | Buyers still showing pressure, buy signal |
Summary: Indicators are mixed. MACD and the Ultimate Oscillator lean bearish, while ADX and Bull/Bear Power suggest buyers are still active. RSI and CCI remain neutral, pointing to indecision.
🔮 Ethereum Price Prediction Scenarios
Bullish Scenario:
A strong break above $2,600 could open the door to $2,700 or $2,800. But with strong volume.
Neutral Scenario:
If $2,480 keeps holding, ETH price will probably keep moving sideways between $2,480 and $2,575.
Bearish Scenario:
If ETH drops below the $2,480 zone, it could head toward $2,350 or even lower if sellers step in.
Read Also: This Hidden Signal Might Be the One Altcoin Investors Have Been Waiting For
🧠 Wrapping Up
Ethereum price is still in a holding pattern. It’s not breaking down, but it’s not breaking out either. For now, the $2,480 to $2,575 range is the one to watch. A clear move outside of that range will likely set the direction for what comes next.
Subscribe to our YouTube channel for daily crypto updates, market insights, and expert analysis.