
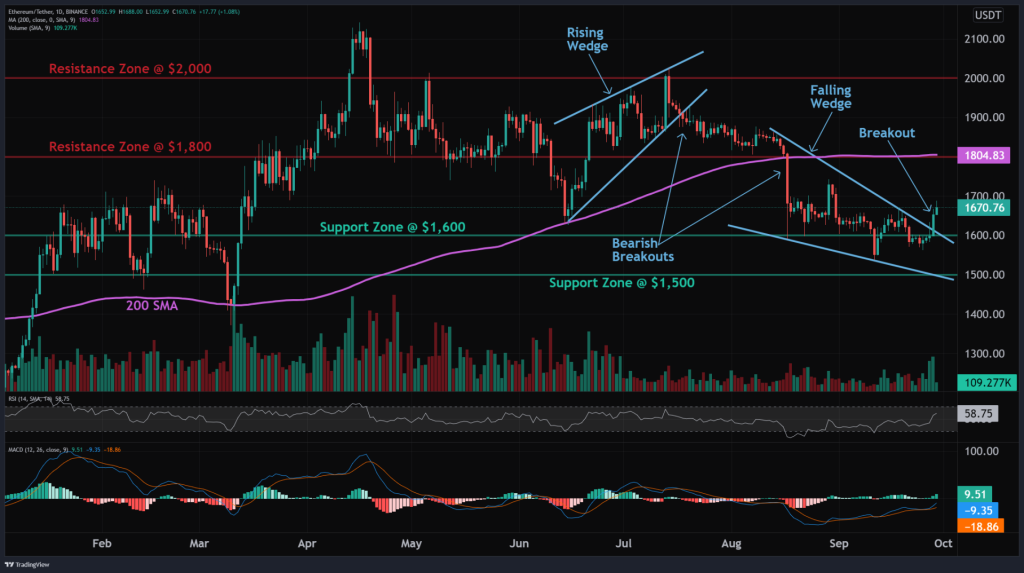
Ethereum’s price is showing signs of a potential bullish breakout from a Falling Wedge pattern above the $1,600 level, according to altFINS. This could indicate that buyers have absorbed the selling pressure and Ethereum is ready to resume an uptrend.
Ethereum had been trading in a Falling Wedge pattern recently. This is usually a bullish pattern that results in a breakout to the upside when the upper trendline is broken. The convergence of the upper and lower trendlines indicates a decrease in bearish momentum and builds up energy for a bullish move.
When the price breaks above the upper trendline, it is expected to begin trending higher. Traders can take advantage of the pattern before the breakout by trading between the convergence lines. However, most traders wait for a completed breakout above the upper trendline before going long.
Source: altFINS – Start using it today
What you'll learn 👉
Trends
On a short-term basis, Ethereum’s trend is currently neutral as it trades between support and resistance. However, the medium and longer-term trends remain in downtrends from the highs earlier this year. A bullish breakout could signal a potential trend reversal.
The momentum indicators are turning bullish for Ethereum. The MACD line is above the signal line, and the RSI has risen above 55. This reflects growing upside momentum.
Support and Resistance
The nearest support zone for Ethereum is around $1,600. Below that, there is support at $1,500.
On the upside, initial resistance is at $1,800, which aligns with the 200-day moving average. This makes it a stiff resistance level. Above that, there is resistance at the psychological $2,000 level.
Trade Idea
Traders may look to go long Ethereum on a confirmed breakout above $1,600 with a target at $1,800 resistance. A stop loss can be placed below $1,500 support. As the pattern has not broken out yet, traders should wait for the breakout before entering a long trade.
In summary, Ethereum’s price shows potential for a bullish breakout above $1,600 if it can break out of the Falling Wedge pattern. The momentum indicators support upside potential as well. If the breakout is confirmed, Ethereum could rally back towards the key $1,800 resistance area where the 200-day moving average aligns. Traders may look to go long on a breakout with an initial target at $1,800.
However, the medium and long-term downtrends remain intact for now, so further gains may be limited. It will be important to watch how Ethereum acts around the key resistance zone before determining if a trend reversal is unfolding. Setting price alerts around the $1,600 breakout level and $1,800 resistance can help traders monitor price action and prepare to enter trades at opportune times.

We recommend eToro
Wide range of assets: cryptocurrencies alongside other investment products such as stocks and ETFs.
Copy trading: allows users to copy the trades of leading traders, for free.
User-friendly: eToro’s web-based platform and mobile app are user-friendly and easy to navigate.