Ethereum (ETH) continues to be a focal point of interest. The digital asset has been caught in a somewhat monotonous price section, reminiscent of a Wave 4 style. However, the end of the month brings with it core PCE data, a key inflation indicator, which could potentially stir up some volatility.
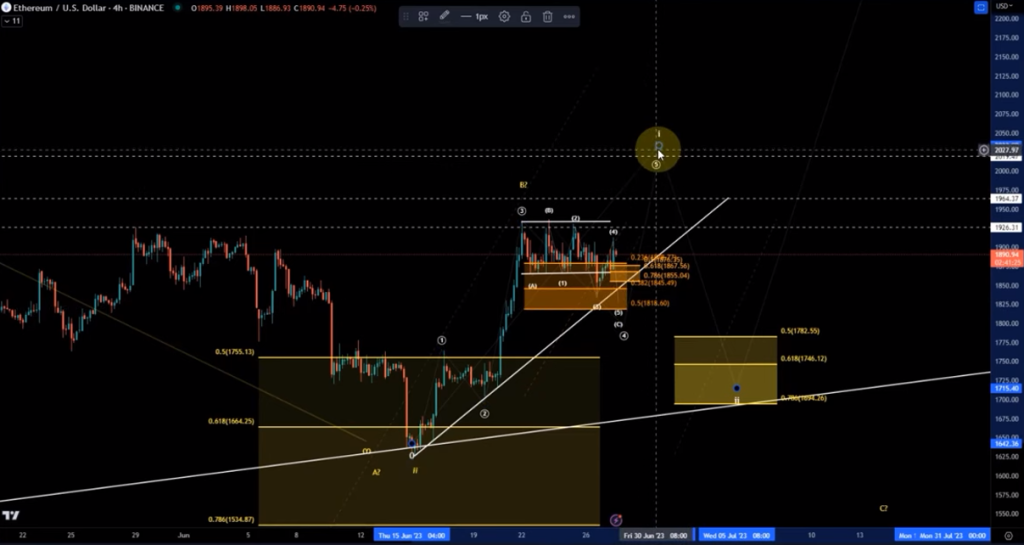
Looking at the bigger picture, Ethereum’s price trajectory since March 10th suggests a wave one rally, peaking in April at around $2135. This was followed by a wxy correction bottoming out on June 15th. The price at this point reacted to an ascending trend line and the golden ratio at $1664, forming a cluster of support levels. This led to a turnaround in the middle of our trend reversal area and a successful upward movement.
Doge2014 raises 500K in days celebrating Dogecoin. Make potentially big profits and get in on exclusive airdrop!
Show more +The current analysis suggests an unfolding of an aggressive diagonal structure or an incomplete impulse to the upside, with one more wave potentially missing. While this additional high is not a necessity, it is currently expected.
In the short term, Ethereum’s performance has been somewhat weaker than Bitcoin’s, but this dynamic is subject to change. If we consider the rally into the April high as a wave one and the subsequent drop as a wave two, as long as the low of $1630 remains intact, the overall focus can be on a higher third wave rally.

Source: TradingView
In the short-term bullish scenario, we have seen a wave one to the upside, a wave two to the downside bottoming on June 19th, a third wave rally peaking last Wednesday, and we could still be in the fourth wave with one more high missing in a fifth wave. This would complete a nice five-wave move to the upside in a wave one. This scenario is valid as long as Ethereum holds at $1818. After this fifth wave, we would ideally expect a wave two pullback.
In the event of a break below $1818, we would be looking at a direct pullback into the wave two support area. Then the assumption would be that wave five of one already topped on Friday and we’re already in a wave two. We then have support all the way down to $1694. Below $1694, things turn slightly more bearish, but at the moment there is still a lot of space between the current price and $1694, so there’s a good chance we’re going to hold that.
Ethereum’s current trajectory suggests a bullish outlook, with potential for one more high before a pullback. However, this view would need to be revised if Ethereum breaks below $1818. Despite this, the overall bullish outlook of the chart remains intact as long as Ethereum holds at $1694. As always, the world of cryptocurrency is dynamic and subject to rapid change, so it’s crucial to stay informed and adaptable.
Polkadot Takes a Dive: A Technical Breakdown
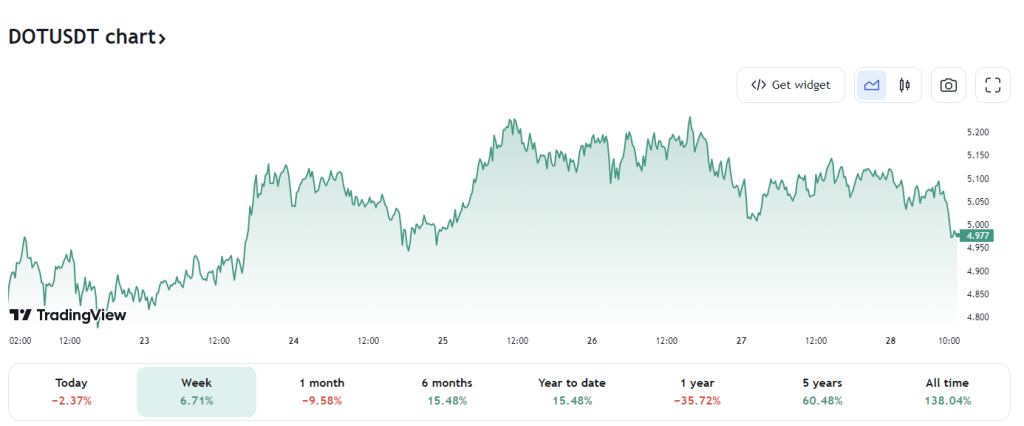
Polkadot (DOT) is always an interesting coin for traders and analysts. A recent analysis indicates that DOT, when paired against Tether (USDT), has broken down from its channel. The Relative Strength Index (RSI), a crucial indicator used to measure the momentum of an asset, is currently near neutral values across various time frames, including 4-hour, 1-hour, and 30-minute charts. This suggests a balance between the buying and selling pressures.

Source: TradingView
Adding intrigue to the situation is the price movement in relation to the Exponential Moving Averages (EMAs). The price of DOT has been consolidating below the 50 EMA on the 1-hour chart. In technical analysis, the 50 EMA is often viewed as a short-term trend indicator. When the price is below this level, it signals a potential bearish trend.
Further compounding the bearish sentiment is the fact that the 50 EMA has crossed below the 200 EMA on the 30-minute chart. This phenomenon, known as a ‘death cross’ among traders, is often interpreted as a bearish signal.
While these indicators suggest a potential decline in the price of DOT, it’s crucial for traders to exercise caution. Cryptocurrency markets are notorious for their volatility, and various external factors such as regulatory news or market sentiment can influence price movements.
For those looking to capitalize on these market movements, it’s advisable to employ risk management strategies and stay informed on the latest market developments. As the market unfolds, only time will tell if the bearish indicators will play out or if DOT will defy the odds and make a recovery.


