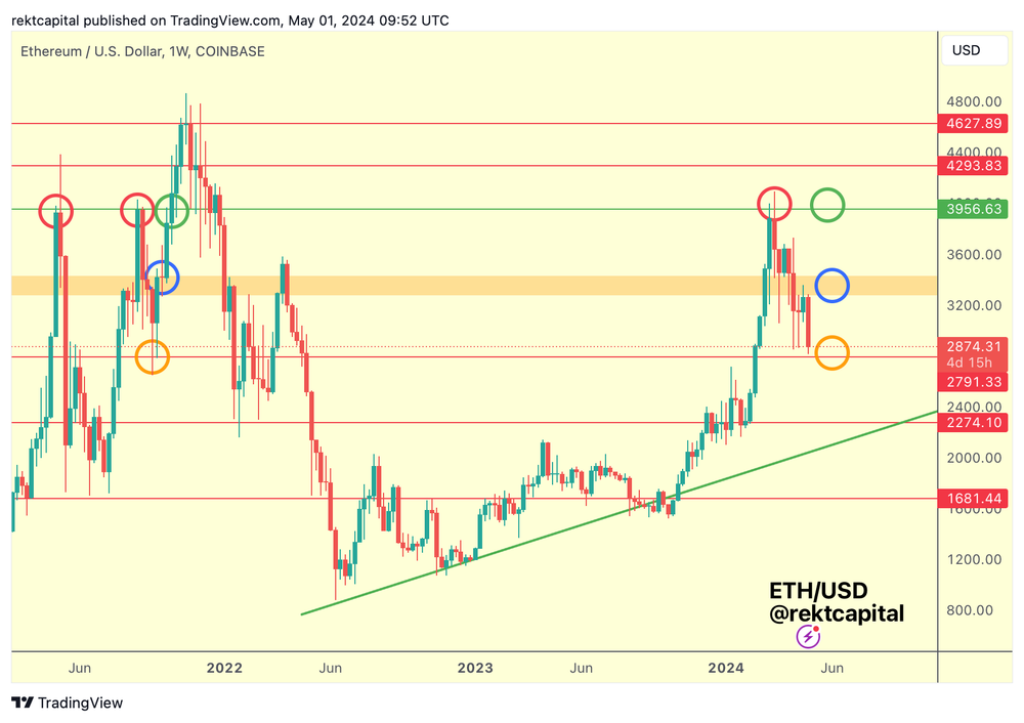
Ethereum (ETH) has recently faced a significant hurdle as it attempted to break above the orange resistance box, which has now been confirmed as the range-high resistance for the new red-orange range spanning from $2,791 to $3,300.
According to Rekt Capital, the rejection at this crucial level has led to a sharp decline in ETH’s price, with the cryptocurrency now tumbling lower into the range and approaching the Range Low support at $2,791, denoted by the orange circle.
In the preceding weeks, ETH exhibited a tendency to form downside wicks near the Range Low without actually touching it. However, the current price action has seen ETH trading at these same downside wicking prices, but in the form of candle bodies rather than mere wicks.
This development suggests a more significant bearish presence in the market, as the price is now directly interacting with the range-low support.

What you'll learn 👉
Range-Bound Consolidation and Potential Downside Wicking
For Ethereum to establish a range-bound consolidation phase within the $2,791-$3,300 range (red-orange), it is crucial for the cryptocurrency to hold support at the range low. Failure to maintain this level could result in further downside pressure and a range breakdown.
The orange circle, representing historical data from mid-2021, suggests that downside wicking could occur even below the $2,791 level. However, as long as the weekly close occurs above this key support, the overall structure will remain bullish.
Doge2014 raises 500K in days celebrating Dogecoin. Make potentially big profits and get in on exclusive airdrop!
Show more +Mixed Trends and Momentum Indicators
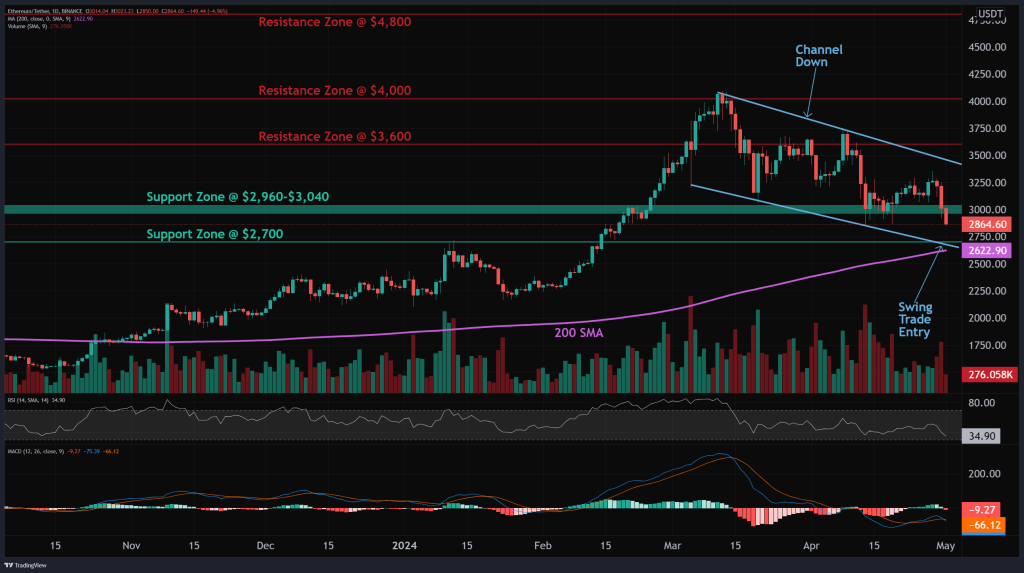
According to the technical analysis provided by altFINS, Ethereum is currently exhibiting mixed trends across different time frames. The short-term trend is bearish, while the medium-term trend is neutral, and the long-term trend remains bullish, with the price trading above the 200-day moving average.
Momentum indicators also present a mixed picture, with the MACD line positioned above the MACD signal line, suggesting bullish momentum. However, the RSI (Relative Strength Index) is below 45, indicating bearish pressure. Moreover, the declining MACD Histogram bars hint at weakening momentum.

Source: altFINS – Start using it today
Support and Resistance Levels to Watch
As Ethereum navigates the current range, traders and investors should keep a close eye on the key support and resistance levels. The nearest support zone lies between $2,960 and $3,040, followed by a more significant support at $2,700. On the upside, the immediate resistance zone is located at $3,600, with further resistance levels at $4,000 and $4,800.
Trading Within the Channel Down Pattern
Ethereum is currently trading within a Channel Down pattern, presenting opportunities for traders to capitalize on the price action. For those who believe that the price will remain within the channel, initiating trades when the price fluctuates between the channel trendlines can be a viable strategy.
Alternatively, traders can wait for a complete pattern, such as a breakout, to occur before entering a position. When the price breaks through either the upper or lower trendline of the channel, it can move rapidly in the direction of the breakout, providing a potential entry point for traders.
Subscribe to our YouTube channel for daily crypto updates, market insights, and expert analysis.
We recommend eToro
Wide range of assets: cryptocurrencies alongside other investment products such as stocks and ETFs.
Copy trading: allows users to copy the trades of leading traders, for free.
User-friendly: eToro’s web-based platform and mobile app are user-friendly and easy to navigate.


