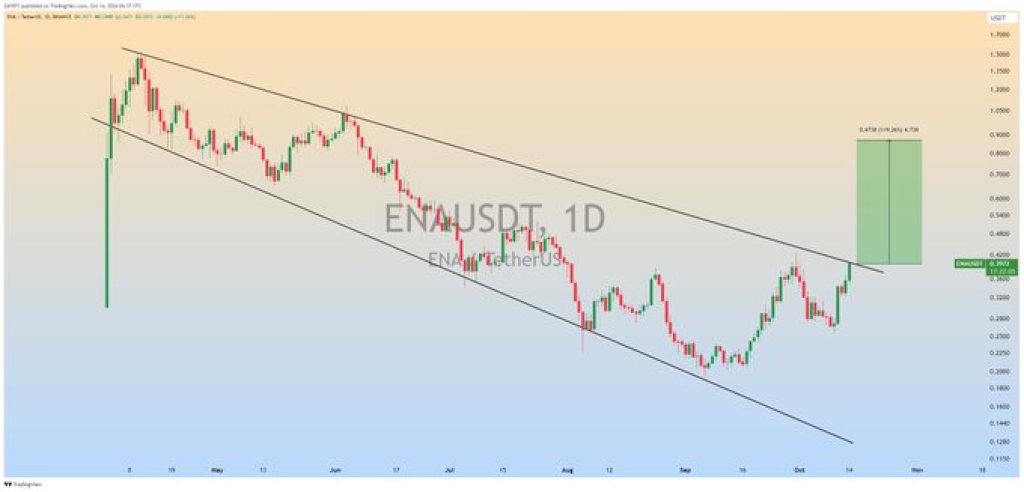
Ethena (ENA) has recently shown promising signs of strength after months of downward price action. Per CoinMarketCap’s data, Ethena’s (ENA) price is the top gainer today in the market, as it saw a 24.59% pump. Its trading volume also saw a 135.35% increase, which means there is a higher interest and activity surrounding ENA.
Crypto analysts ZAYK Charts and Alain Arends shared their insights, suggesting the token could be on the verge of a bullish rally. With a breakout confirmed, these analysts see the potential for substantial gains in the coming months.
Read Also: How Much Could Kaspa (KAS) and SUI Tokens Be Worth at the End of the Bull Run?
What you'll learn 👉
Ethena (ENA) Chart Analysis: Bullish Breakout from Descending Broadening Wedge
The ENA chart reveals a declining broadening wedge pattern, as noted by ZAYK Charts in a tweet. This formation, typically a bullish reversal signal, contained ENA’s price for several months.
According to ZAYK Charts, a breakout above the upper trendline of this pattern could lead to a 100-120% bullish wave.

As predicted, the ENA price broke out from the wedge, signaling a potential end to the bearish trend. The breakout aligns with ZAYK’s forecast of a bullish wave, with price targets between 0.85 and 1.00 USDT. The current price momentum is pushing ENA toward these levels, supported by the widening wedge and upward trajectory.
Doge2014 raises 500K in days celebrating Dogecoin. Make potentially big profits and get in on exclusive airdrop!
Show more +Key Resistance and Support Levels
Following the breakout, the 0.4071 USDT level has emerged as a critical price point. The 8-hour chart indicates that ENA’s price broke above this key resistance level, which previously acted as a rejection zone. This breakout suggests renewed strength in the market, as highlighted by Alain Arends in his analysis.
The recent surge confirms a bullish sentiment. If the price continues above 0.4071, it could transform this level into support, encouraging further upward movement.
However, traders should be mindful of potential pullbacks, with key support levels around 0.25 – 0.30 USDT, should the bullish momentum stall.
Potential for a J-Curve Rally
Alain Arends suggested that the current price movement could resemble a J-curve pattern, a formation known for rapid, exponential growth after a period of decline. He expects this pattern to unfold over higher timeframes, potentially leading to sustained bullish movement.
The wedge breakout and the J-curve pattern show strong evidence of a continued upward trend. Should the price maintain this momentum, the next targets would be between 0.45 and 0.60 USDT, a zone where profit-taking may occur.
Read Also: Bitcoin Price Breaks $66k – Elite Analyst Maps BTC’s Path to Over $71k
Market Sentiment and Future Prospects
The market’s current sentiment toward ENA is bullish. The breakout from the downtrend and the rise above resistance levels indicate a possible long-term reversal. Traders are watching the volume to confirm the breakout, as higher volume would lend more credibility to the rally.
With analysts expecting substantial gains, ENA’s price could continue its upward trajectory in the coming months. However, caution is advised, as pullbacks and false breakouts are always possibilities in volatile crypto markets.
Subscribe to our YouTube channel for daily crypto updates, market insights, and expert analysis.
We recommend eToro
Wide range of assets: cryptocurrencies alongside other investment products such as stocks and ETFs.
Copy trading: allows users to copy the trades of leading traders, for free.
User-friendly: eToro’s web-based platform and mobile app are user-friendly and easy to navigate.


