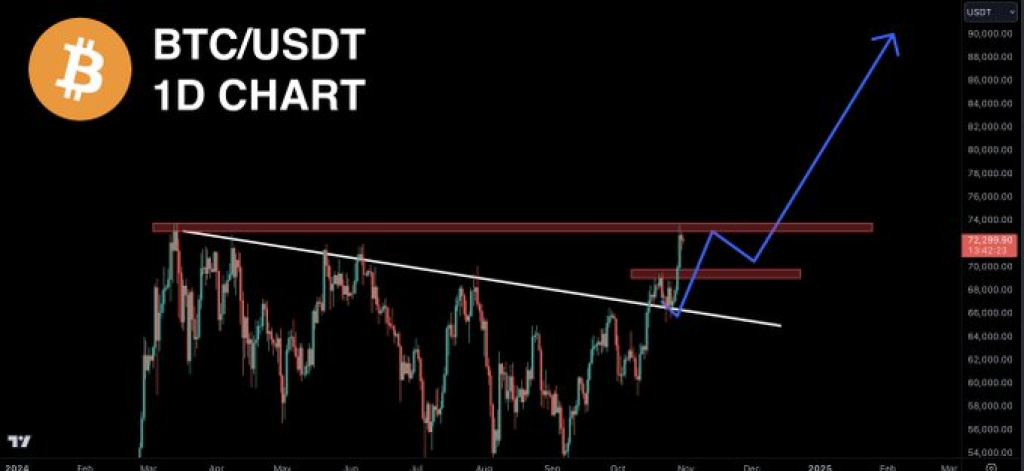
Prominent analyst Market Spotter revealed on X (previously Twitter) that a substantial increase in the price of Bitcoin (BTC) is imminent. However, Bitcoin’s may soon test important resistance levels, which, if overcome, might open the door to a new all-time high (ATH).
What you'll learn 👉
Bitcoin Chart Analysis: Key Resistance Levels in Focus
Two noticeable resistance zones can be seen on the Bitcoin chart, each of which represents a potential obstacle that the price of the cryptocurrency must get beyond to maintain its upward trend. The first zone is around $72,000, which BTC is approaching.
The second, located closer to $85,000, is identified as the “last resistance” before BTC can enter uncharted territory. Clearing this second resistance would position Bitcoin for a powerful upward push, potentially marking a new ATH.

This bullish outlook is based on the recent breakout above a long-term descending trend line, which has historically kept BTC’s price under pressure. Breaking above this trend line indicates a shift in market sentiment and suggests increased buying interest that may continue if BTC’s price surpasses these key resistance levels.
Doge2014 raises 500K in days celebrating Dogecoin. Make potentially big profits and get in on exclusive airdrop!
Show more +Potential Consolidation and Path to New Highs
Following its breakout from the descending trend line, Bitcoin may consolidate around the first resistance level of $72,000. The chart suggests a possible short-term pullback, where BTC could retest the breakout level before attempting a more substantial upward move.
This retest could provide an opportunity for further accumulation, allowing BTC’s price to gain the momentum needed to break through $85,000.
If BTC clears this zone, it may experience a strong rally fueled by bullish sentiment. The chart’s upward trajectory indicates that once these resistance zones are surpassed, BTC could gain substantial ground, making it one of the top-performing assets in the crypto market.
Read Also: Why Is Maker (MKR) Price Surging and PYTH Breaking Resistance? Here’s the Outlook
Support and Market Sentiment
While the chart does not explicitly show support levels, the breakout zone around the trend line could serve as a new support level if BTC faces a pullback. In technical analysis, former resistance levels often turn into support, suggesting that the BTC price may find buying interest near this area in the event of a price drop.
The sentiment behind this potential rally is underscored by Market Spotter’s tweet, emphasizing the importance of surpassing this “last resistance” for BTC to reach new highs. This perspective aligns with historical price movements, where BTC’s price breakouts above established resistance levels have often led to sharp upward trends.
Subscribe to our YouTube channel for daily crypto updates, market insights, and expert analysis.
We recommend eToro
Wide range of assets: cryptocurrencies alongside other investment products such as stocks and ETFs.
Copy trading: allows users to copy the trades of leading traders, for free.
User-friendly: eToro’s web-based platform and mobile app are user-friendly and easy to navigate.


