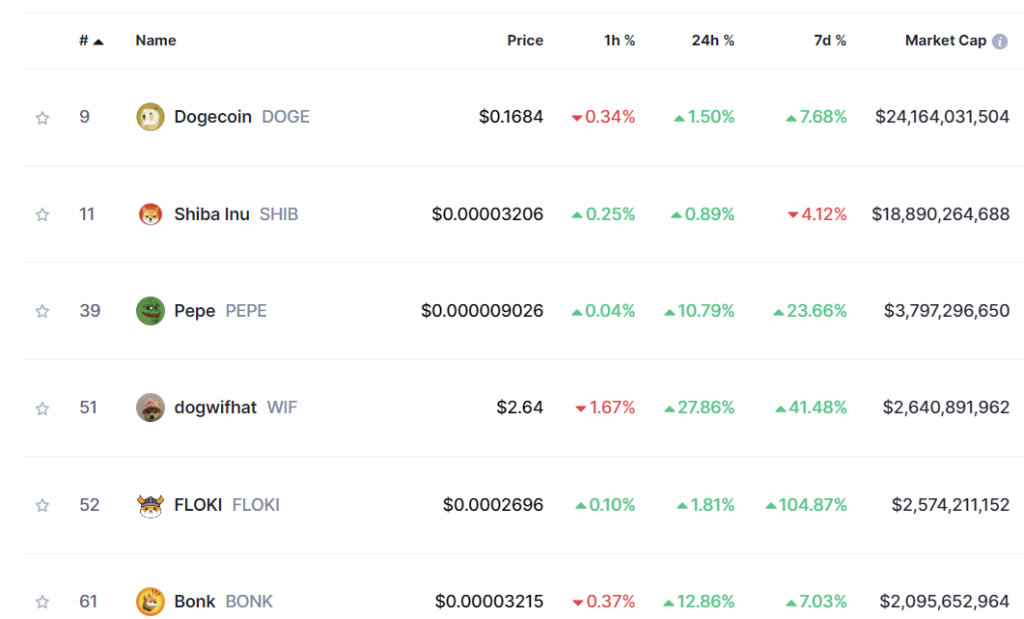
The latest bull run in the crypto markets has been accompanied by a surge in meme coin popularity, capturing investor attention worldwide. Major meme coins like SHIB, BONK, PEPE, DOGE, and the Dogwifhat-inspired WIF saw massive price pumps in late February and early March, fueling the meme coin craze. However, as the week progressed, most prominent meme coin prices cooled off, with one exception – WIF, which continued its impressive rally with another 50% surge.
What you'll learn 👉
The Dogwifhat Phenomenon
Dogwifhat (WIF) is a meme coin inspired by the viral Dogwifhat meme featuring a Shiba Inu donning a distinctive hat. While other meme coins like DOGE and BONK managed modest 7% gains, and SHIB even saw a 4% dip, WIF’s price skyrocketed by over 40%. PEPE also performed well with a 23% increase, but WIF’s rally stood out.

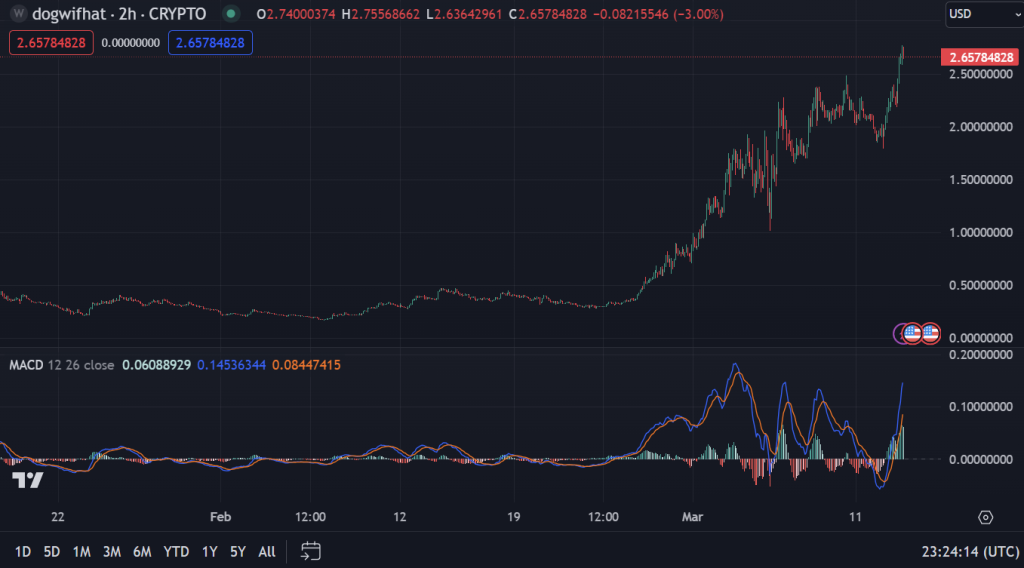
According to technical analysis, WIF’s price chart reveals that the coin traded in a moderately ascending channel since December before finally breaking out strongly in late February when the meme coin mania took hold. At the time of writing, WIF’s price stands at $2.6, with a current market cap of around $2.5 billion, making it a massive player in terms of market capitalization. To be precise, only DOGE, SHIB, and PEPE have a bigger market cap than WIF.
Doge2014 raises 500K in days celebrating Dogecoin. Make potentially big profits and get in on exclusive airdrop!
Show more +Analyzing the Indicators
The Relative Strength Index (RSI) is a momentum oscillator that measures the speed and change of price movements. It oscillates between 0 and 100, with readings above 70 indicating overbought conditions and below 30 suggesting oversold conditions.
WIF’s RSI is hovering around 60 on various timeframes (weekly, monthly, yearly, etc.), indicating strong buying pressure but not excessive levels that could signal an imminent correction. This level suggests that WIF’s rally may have some steam left, as the market sentiment remains bullish, and the uptrend could potentially continue.

The Moving Average Convergence Divergence (MACD) is a trend-following momentum indicator that shows the relationship between two moving averages of a security’s price.
A bullish signal is generated when the MACD Line crosses above the MACD Signal Line, suggesting a potential uptrend. In WIF’s case, the MACD Line being above the MACD Signal Line indicates that the bullish momentum is gaining strength, and the uptrend is likely to continue, supporting the idea that WIF’s rally may have further room to run.
Potential Resistances and Targets
While $2.17 acts as a strong support level, in line with the 0.236 Fibonacci retracement level, the next major resistance levels for WIF lie at $3.06, corresponding to the 2.618 Fibonacci extension level, and $4.3, the 3.618 Fibonacci extension level. Surpassing these resistance levels could pave the way for WIF to establish new all-time highs.
However, it’s crucial to remember that WIF is still a meme coin without real utility, and despite its massive market cap, the potential for substantial 10-20x gains from current levels may be limited.
As the meme coin craze continues, WIF has outshined its rivals, but investors should exercise caution and conduct thorough research before making any investment decisions in this highly speculative market segment.
You may also be interested in:
- Top 7 Token Unlocks to Watch This Week: Arbitrum (ARB), Aptos (APT) and More
- 4 Less Popular Meme Coins and NFT Collections to Watch This Bull Market
- Global Surge in Raffle Coin (RAFF) Presale: Avalanche (AVAX) & Polkadot (DOT) Bulls Predict an Explosive 35X Growth
We recommend eToro
Wide range of assets: cryptocurrencies alongside other investment products such as stocks and ETFs.
Copy trading: allows users to copy the trades of leading traders, for free.
User-friendly: eToro’s web-based platform and mobile app are user-friendly and easy to navigate.


