The price of dogwifhat has spiked by more than 20% in the past 48 hours, bringing investors’ attention to the token.
The price spike started as a reaction to a more general bullish move in the market. However, WIF’s price action also suggests its ongoing rally may not last.
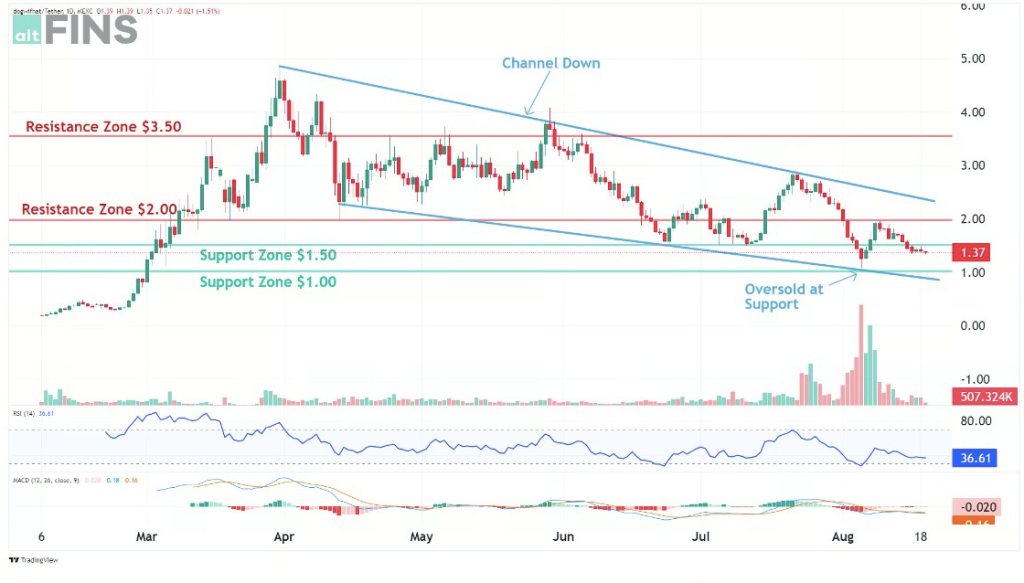
Dogwifhat is in a channel-down pattern, which typically indicates a bearish trend. The price hits the lower trendline as support and the upper trendline as resistance.
Doge2014 raises 500K in days celebrating Dogecoin. Make potentially big profits and get in on exclusive airdrop!
Show more +Read Also: Dogecoin Price Poised for 513% Surge: Meme Coin Analyst Highlights These Key Bullish Indicators
The price reached the lower trendline a few days ago and bounced off it. However, it could not maintain the bullish move to the top of the channel, making it start to fall again. WIF bulls are now leveraging the more general market strength as they spike above a key resistance at around $1.5.
Crypto analytics firm AltFINS made an analysis that shows there are still significant resistances that could limit growth.
Based on their analysis, short-term, medium-term, and long-term trends are currently in a strong downtrend, indicating persistent bearish pressure. This suggests that until a breakout occurs, the price is likely to continue its downward trajectory within the channel (with only some upward retracements).

Source: altFINS – Start using it today
The nearest support levels are at $1.50 and $1.00. These levels could provide a base where buyers may step in, particularly if the price reaches the lower trendline of the channel near these zones.
The nearest resistance levels are at $2.00 and $3.50. A breakout above the channel and these resistance levels could signal a reversal in the current downtrend and a shift to a bullish outlook.
The RSI is currently at 36.61, indicating that the price is approaching oversold levels but is not yet there. This suggests that there could be further room for downside movement before a potential reversal.
Read Also: Bitcoin Price Prediction: Expert Maps BTC’s Path To 100k, But There’s a Catch
FLOKI Meme Coin Showing Signs of Bullish Continuation
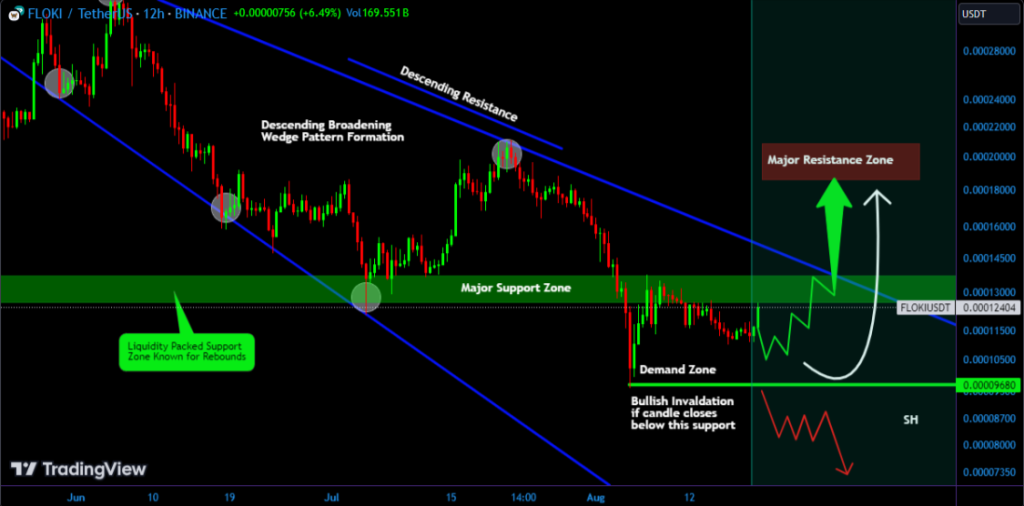
Crypto analyst on TradingView, MyCryptoParadise_Simon, revealed that FLOKI meme coin is currently exhibiting signs of a bullish continuation from a critical support zone at $0.000125.
The analyst notes that they have been monitoring FLOKI as it trades within a descending broadening wedge pattern, and now it’s attempting to break above the descending resistance line.
If FLOKI maintains its strength at this level, we could be witnessing the start of a significant bullish rally, echoing previous trends.

A breakout above the key resistance zone at $0.000126-$0.000137 could potentially clear the path for a run toward the next resistance levels and beyond.
However, should momentum weaken at this critical support, we might observe a rebound from the lower demand area around $0.000096. Furthermore, a daily close below the demand area could invalidate the bullish scenario and signal further declines.
Subscribe to our YouTube channel for daily crypto updates, market insights, and expert analysis.
We recommend eToro
Wide range of assets: cryptocurrencies alongside other investment products such as stocks and ETFs.
Copy trading: allows users to copy the trades of leading traders, for free.
User-friendly: eToro’s web-based platform and mobile app are user-friendly and easy to navigate.


