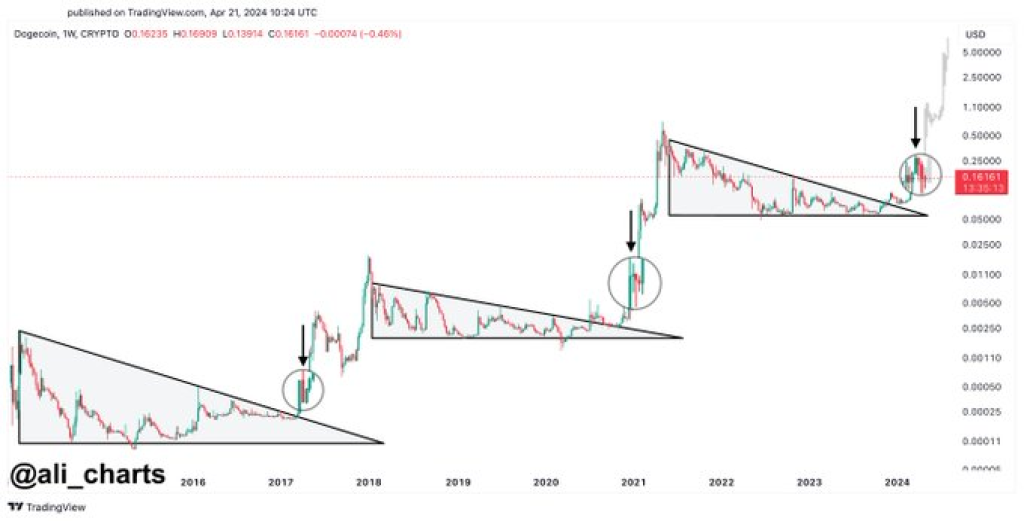
Dogecoin (DOGE), the popular meme-inspired cryptocurrency, is once again displaying its classic pattern, according to crypto analyst Ali. After breaking out of a descending triangle, DOGE is currently consolidating, leading to speculation that the token might be poised for a significant rally towards the $1 mark in the coming weeks.

What you'll learn 👉
Technical Analysis
A recent technical analysis by altFINS provides valuable insights into Dogecoin’s current market setup and potential trading opportunities.
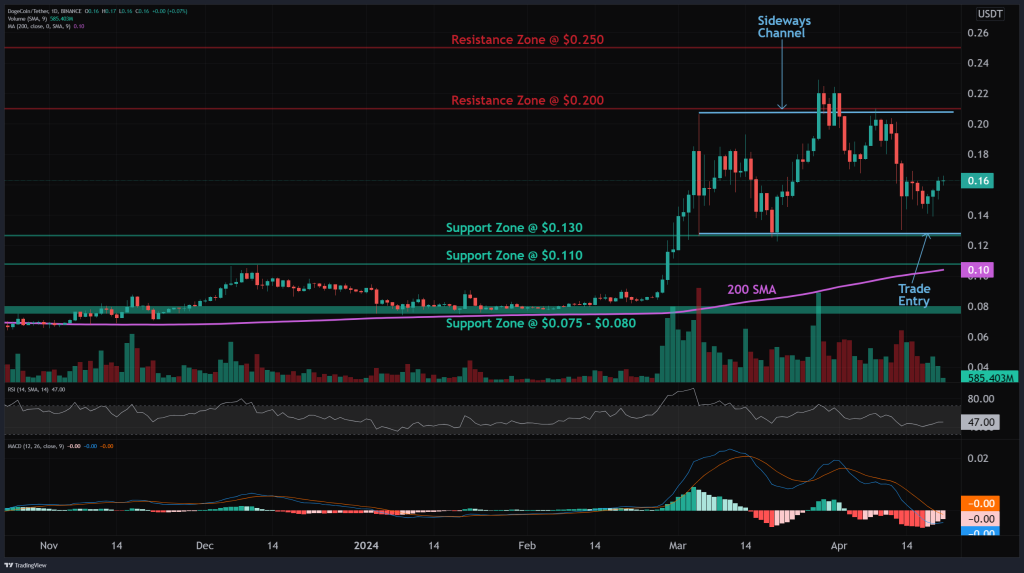
Dogecoin’s price trends are currently mixed, with the token consolidating within a sideways channel ranging from $0.13 to $0.20. This neutral pattern indicates market indecision, and trend traders are advised to wait for a breakout in either direction before taking a position. However, the long-term trend remains bullish, suggesting that a breakout to the upside is more likely.

Source: altFINS – Start using it today
Swing Trading Opportunities
For swing traders, the current consolidation presents an attractive opportunity to capitalize on the range-bound price action. By entering near the channel support at $0.13 and exiting near the horizontal resistance at $0.20, traders can potentially secure a 50% gain. A stop-loss level should be set at $0.12 to manage risk.
The momentum indicators for Dogecoin are currently mixed. The MACD (Moving Average Convergence Divergence) line is below the MACD signal line, indicating a bearish momentum. However, the RSI (Relative Strength Index) is hovering around 50, suggesting a neutral momentum.
Interestingly, the MACD histogram bars are rising, which could signal that the momentum is nearing another upswing. This development further supports the potential for a bullish breakout in the near future.
Doge2014 raises 500K in days celebrating Dogecoin. Make potentially big profits and get in on exclusive airdrop!
Show more +Key Support and Resistance Levels
For traders and investors looking to make use of Dogecoin’s price action, it is crucial to keep an eye on the key support and resistance levels. The nearest support zone is located at $0.130, followed by $0.110. On the upside, the nearest resistance zone is situated at $0.200, with the next significant resistance level at $0.250.
A decisive breakout above the $0.200 resistance level could open the door for a substantial rally towards the $1 target, as suggested by analyst Ali.
Historical Precedence
Dogecoin’s current price action is reminiscent of its previous patterns, which have often led to significant rallies. The breakout from the descending triangle and the ongoing consolidation phase are seen as bullish indicators by many traders and analysts.
If history were to repeat itself, Dogecoin could be on the verge of another impressive surge, potentially leading to a retest of its all-time high or even a push towards the coveted $1 level.
As Dogecoin consolidates after its recent breakout, the stage appears to be set for a potentially significant rally in the coming weeks. While the technical indicators present a mixed picture, the rising MACD histogram bars and the long-term bullish trend suggest that a breakout to the upside is more likely.
Subscribe to our YouTube channel for daily crypto updates, market insights, and expert analysis.
We recommend eToro
Wide range of assets: cryptocurrencies alongside other investment products such as stocks and ETFs.
Copy trading: allows users to copy the trades of leading traders, for free.
User-friendly: eToro’s web-based platform and mobile app are user-friendly and easy to navigate.


