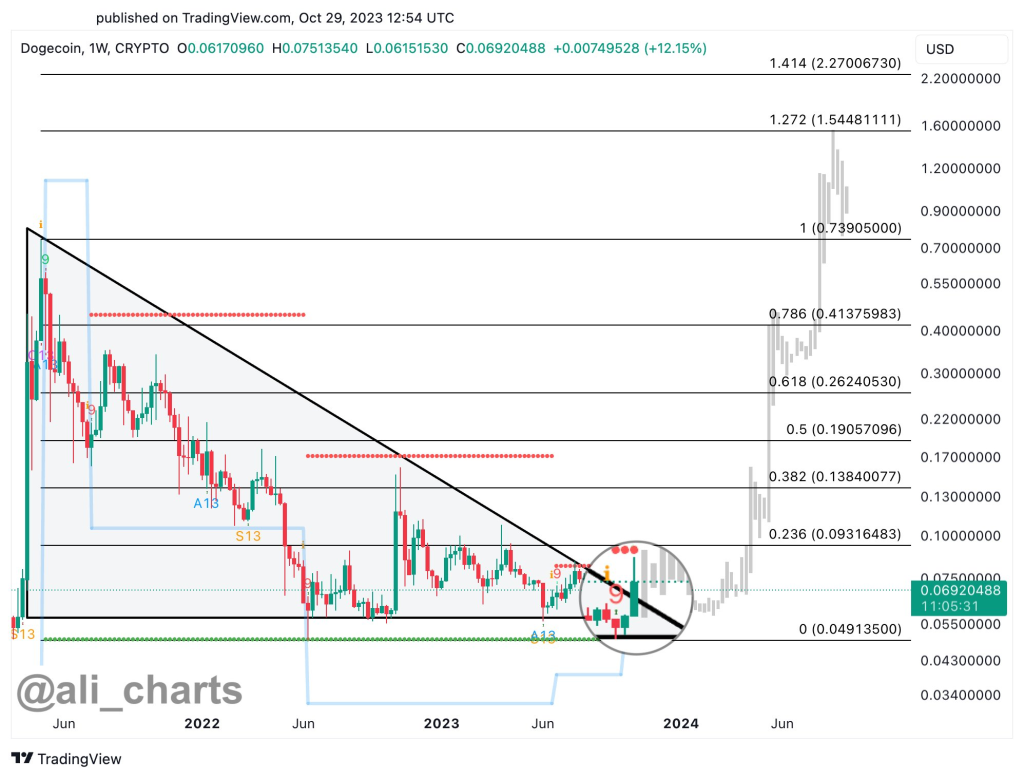
Dogecoin (DOGE) has seen renewed interest this week after breaking out from a multi-year descending triangle pattern on its weekly chart, according to crypto analyst Ali.
Ali pointed out that Dogecoin’s move higher confirms a buy signal from the TD Sequential indicator on the weekly timeframe. This adds to the bullish case for the meme-inspired cryptocurrency.
“Dogecoin shows promising signs, breaking out from a multi-year descending triangle on the $DOGE weekly chart! The confirmation of a buy signal from the TD Sequential indicator within this timeframe reinforces DOGE bullish outlook.” said Ali.

Dogecoin has rallied around 15% over the past week. However, the price is currently facing resistance around the $0.07 level, which aligns with its 200-day moving average.
According to Ali, Dogecoin needs to break above and hold the $0.07 level in order to confirm an uptrend. This would imply a shift from its long-term downtrend to a new bullish trend.
The relative strength index (RSI), a technical indicator measuring momentum, is currently around 64 for Dogecoin on the weekly chart. An RSI above 70 is considered overbought territory where the asset may be primed for a pullback.
Read also:
- Why Kaspa (KAS) Will Mirror Solana’s 2021 Success
- Top BTC Expert Explains Why This Bitcoin Pump Is Just Getting Started
- XRP and SEC likely to go for settlement in November, as InQubeta eyes $4 million in presale
If Dogecoin can gain acceptance above its 200-day moving average, it could target further upside toward the next resistance around $0.08. However, failure to break above $0.07 could see the rally stall in the near-term. Traders will be closely watching whether the meme coin can build on its recent bullish momentum.
We recommend eToro
Wide range of assets: cryptocurrencies alongside other investment products such as stocks and ETFs.
Copy trading: allows users to copy the trades of leading traders, for free.
User-friendly: eToro’s web-based platform and mobile app are user-friendly and easy to navigate.


