Dogecoin has been drifting lower lately, and on the surface, the chart doesn’t exactly scream excitement.
The DOGE price has slid back toward the $0.12–$0.13 area, momentum has cooled off, and a lot of traders seem to have checked out. But once you zoom out and look at the bigger picture, the recent move starts to look a lot more intentional than random.
As BitGuru pointed out, DOGE has a long history of building bullish structures before major moves higher. Those rallies rarely start when everything feels comfortable. More often than not, they begin after deep pullbacks that shake out impatient traders. That’s exactly what this setup looks like right now.
What you'll learn 👉
DOGE Has Done This Before
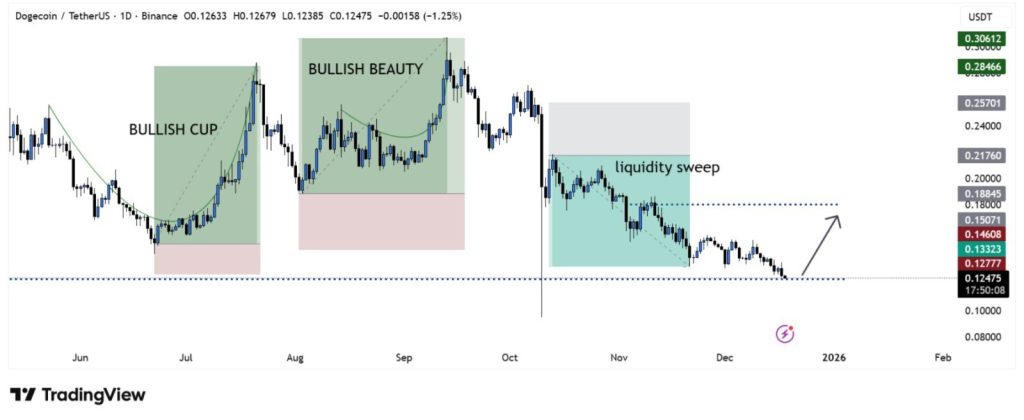
If you look back at earlier cycles on the chart, the pattern feels familiar. Dogecoin previously formed rounded, cup-like bases followed by higher lows and strong expansions to the upside.
Those moves didn’t happen overnight, and they definitely didn’t start when sentiment was overly bullish. What’s interesting is how closely the current structure lines up with those past phases. After peaking earlier this year, DOGE sold off hard and slipped below a key support level.
In real time, that move looked ugly. But structurally, it mirrors the kind of resets that came before earlier rallies.
The Recent Drop Looks Like a Liquidity Flush
The sharp sell-off into November fits the definition of a liquidity sweep. The DOGE price pushed below an obvious support zone, triggering stop losses and forcing weaker hands out of their positions. Once that liquidity was cleared, selling pressure began to ease.
This is often how markets reset. Stronger players tend to wait for moments of panic, step in quietly, and let price stabilize rather than chasing it higher.
The fact that DOGE stopped accelerating lower is a sign that the worst of the flush may already be behind it.
Why This DOGE Price Zone Matters
The Dogecoin price is now sitting in an area that has acted as a base several times before. This isn’t just another random level on the chart. It’s a zone where buyers have shown up in the past after similar pullbacks.
As long as DOGE can hold above this region and avoid another sharp breakdown, the structure stays intact. It doesn’t need to rip higher immediately. What matters more is that price starts to stabilize and build a foundation.
Read Also: Here’s Why Bitcoin Price Is Holding Firm While Top Altcoins Keep Bleeding
What the DOGE Chart Is Hinting At Next
The projected move on the DOGE chart points toward a possible recovery back into the $0.18–$0.20 range. That wouldn’t require renewed hype or a full trend reversal. It would simply be a rotation back toward previous value after liquidity has been cleared.
If the DOGE price can reclaim that zone, the broader bullish structure starts to come back into focus. If not, the market may need more time to base. Either way, the recent drop looks less like a breakdown and more like a reset.
Right now, Dogecoin isn’t grabbing headlines, and historically, that’s often when the most important setups are forming. The chart indicates patience is still the right approach, but the structure itself hasn’t gone anywhere.
Subscribe to our YouTube channel for daily crypto updates, market insights, and expert analysis.