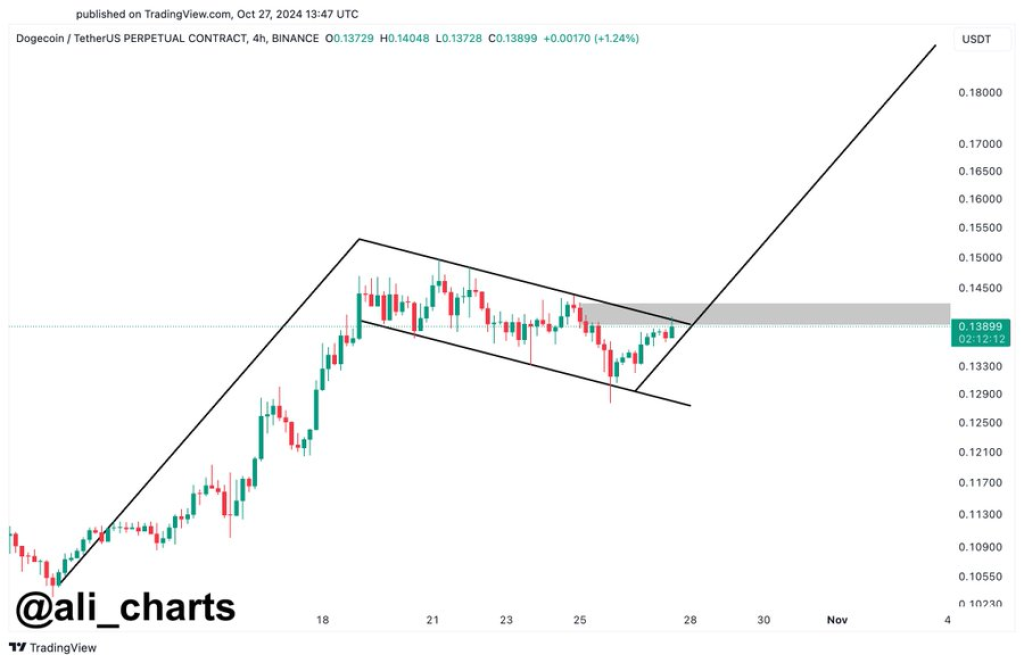
Ali presents a Dogecoin (DOGE) chart that shows a clear descending channel or flag pattern. This pattern commonly occurs during a consolidation phase that follows an uptrend.
Currently, DOGE is trading around $0.139, with a noticeable resistance zone identified at approximately $0.143, marked in gray on the chart.
According to the analyst’s insights, if Dogecoin manages to break through this resistance level, it could indicate a potential continuation of its previous upward trajectory.
Read Also: Shiba Inu Holders, Take Note! Analyst Reveals Game-Changing Development for SHIB Price

The analyst projects that a successful breakout above $0.143 could lead to a significant rally of about 25%, potentially elevating DOGE’s price to around $0.175. This projection is supported by the upward arrow in the chart, which suggests a price target contingent on a successful breakout.
Such a breakout would likely generate increased buying momentum, further propelling the price toward the $0.175 level. If DOGE fails to surpass the resistance at $0.143, the price may remain in a consolidation phase within the current pattern.
Doge2014 raises 500K in days celebrating Dogecoin. Make potentially big profits and get in on exclusive airdrop!
Show more +Subscribe to our YouTube channel for daily crypto updates, market insights, and expert analysis.
We recommend eToro
Wide range of assets: cryptocurrencies alongside other investment products such as stocks and ETFs.
Copy trading: allows users to copy the trades of leading traders, for free.
User-friendly: eToro’s web-based platform and mobile app are user-friendly and easy to navigate.


