The Dogecoin (DOGE) price has spent most of the past year doing one thing, drifting lower. Each bounce failed, rallies sold off quickly, and interest slowly faded. That trend pushed DOGE back toward levels not seen since before the last major cycle.
Now, the chart is starting to tell a different story. Veteran trader Matthew Dixon points out that Dogecoin has printed a clear bullish divergence on the higher timeframe.
This comes after a long stretch of steady selling and follows a textbook bearish divergence that correctly warned of the previous drop. In simple terms, momentum is no longer moving in the same direction as price – and that often matters.
What you'll learn 👉
What the Dogecoin Chart Is Showing
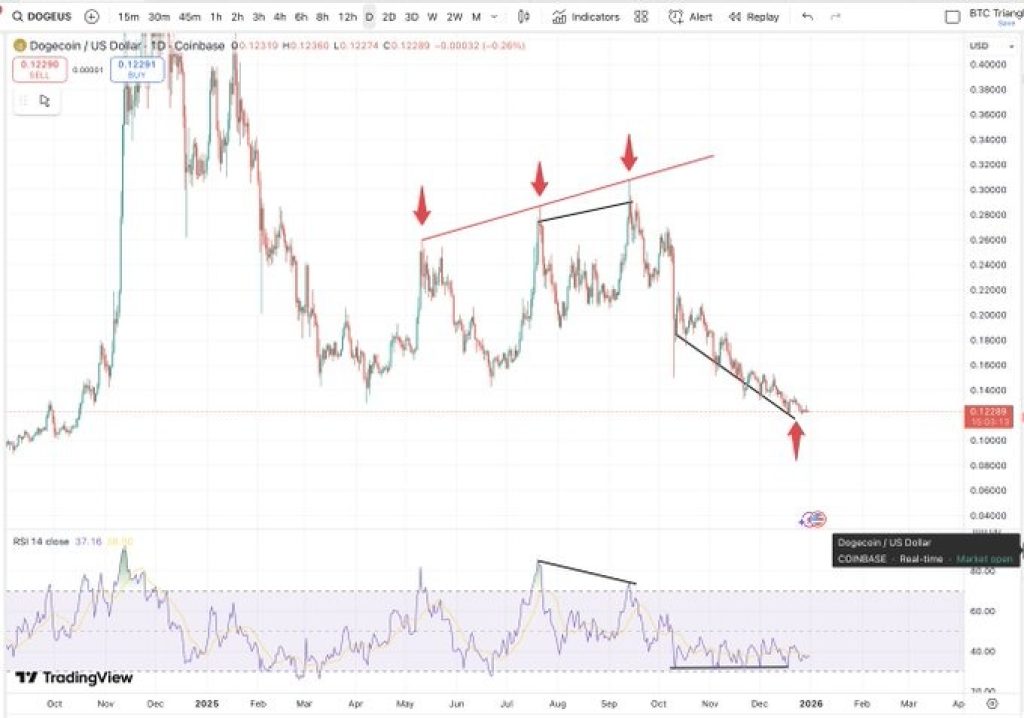
On the weekly chart, DOGE has been making lower lows for months. Price rolled over again after failing near the mid-$0.20s and continued to slide toward the $0.14–$0.15 area.
At the same time, momentum indicators stopped confirming the downside. While the DOGE price pushed lower, RSI started making higher lows. This mismatch between price and momentum is what traders call bullish divergence.
This pattern usually shows up when sellers begin to lose control. It does not mean price must rally immediately, but it often marks the early stage of a shift in direction.
Dixon notes that the last time this setup appeared, the DOGE price eventually followed with a strong move higher. The key difference now is that the signal is forming after a long downtrend, not near the top.
Why This Signal Matters Now For DOGE
Bullish divergence works best after extended declines. That is exactly the situation the Dogecoin price is in.
Selling pressure has been persistent, but it has also become slower and less aggressive. Each push lower is smaller than the last. Volatility has compressed, and price is spending more time moving sideways instead of falling sharply.
Read Also: ChatGPT Predicts the Hedera (HBAR) Price in January
This tells us that sellers may be running out of strength. Buyers are not chasing yet, but they are no longer completely absent either.
It is also important that this signal appears on a higher timeframe. Weekly divergences tend to carry more weight than short-term signals, especially when they form after months of downside.
What Happens Next for DOGE
A bullish divergence is not a guarantee. It is a warning sign that the trend may be changing.
one should monitor how price can resist dropping below current levels. So long as DOGE is trading above $0.13-0.14, the divergence will be in effect.
However, if the new support holds, and the DOGE price begins to move back up and reclaim some of the earlier support levels, this may be seen targeting the $0.18-0.20 range. That would be the first sign of momentum reversal.
If price breaks lower and momentum follows, the signal fails. For now, the chart suggests Dogecoin may be closer to a turning point than another breakdown. After months of steady selling, that alone is a meaningful change.
Subscribe to our YouTube channel for daily crypto updates, market insights, and expert analysis.