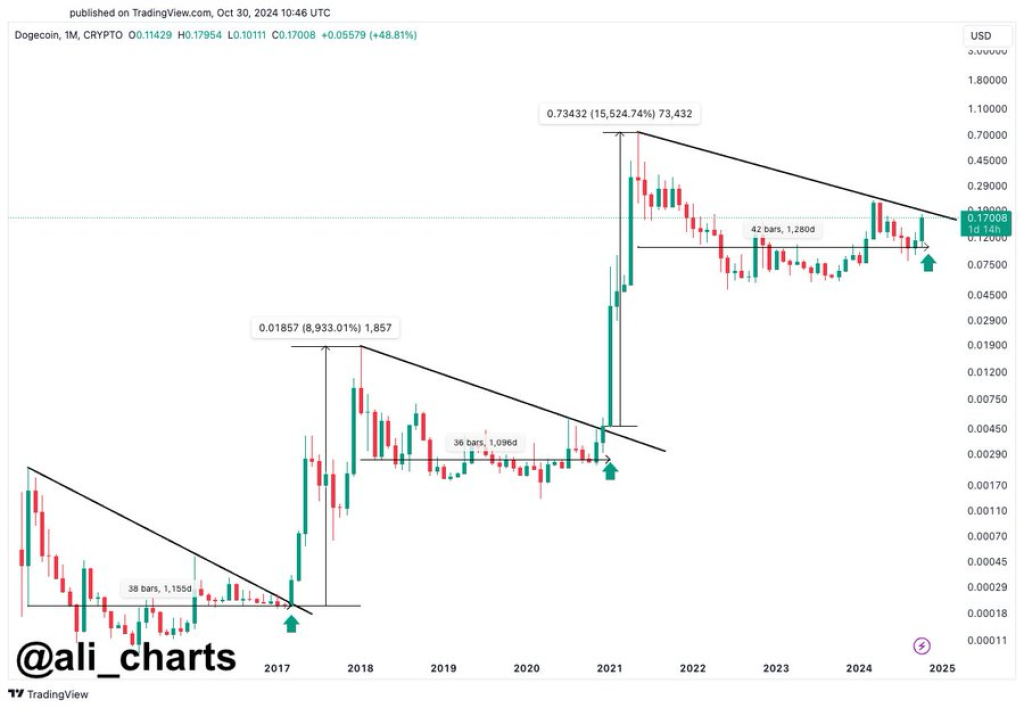
Ali, a crypto analyst, highlights that historical trends suggest November could ignite a parabolic bull run for Dogecoin (DOGE). He emphasizes the importance of monitoring a sustained close above the critical $0.20 mark.
The analyst presents a chart illustrating three notable descending triangle patterns on Dogecoin’s monthly timeframe, each followed by significant breakouts. He breaks down these patterns to analyze their implications for potential future movements.
Read Also: Is PEPE Price Ready to Skyrocket? Key Support Holds for Major Move!
What you'll learn 👉
Key Observations from Historical Patterns:
First Pattern (2015-2017):
A descending triangle developed over approximately 38 months. The price surged past the descending trendline, resulting in an astronomical gain of over 8,933%, marking Dogecoin’s inaugural major rally.
Following an extended consolidation within the triangle, a bullish breakout led to parabolic price movement.

Second Pattern (2018-2021):
Another similar descending triangle formed, lasting about 36 months. This breakout was even more substantial, yielding a gain exceeding 15,524%. The setup and duration closely mirrored the first, leading to another significant rally after a confirmed breakout above the trendline.
Current Pattern (2022-Present):
A comparable descending triangle pattern is currently in play, with Dogecoin consolidating for roughly 42 months. The price approaches the upper boundary of the triangle, near the $0.20 level, which serves as a critical resistance.
According to the analyst, a sustained monthly close above $0.20 could confirm a breakout, potentially triggering another parabolic surge reminiscent of previous patterns.
Read Also: How Much Will 100,000 JasmyCoin (JASMY) Tokens Be Worth in This Bull Run?
Doge2014 raises 500K in days celebrating Dogecoin. Make potentially big profits and get in on exclusive airdrop!
Show more +Ali’s Analysis: Key Levels to Watch
Ali indicates that history may repeat itself, with November poised to initiate a bullish run for Dogecoin if it achieves a sustained close above $0.20. This price point represents the upper boundary of the descending triangle.
A breakout and hold above this level would signify strength and likely attract significant buying interest. The consistent pattern structure and breakout behavior across all three instances suggest that Dogecoin could be on the verge of another explosive move if it closes above the trendline resistance.
Previous breakouts from similar setups have resulted in exponential gains, although past performance does not guarantee future results.
Surpassing the $0.20 mark may generate a fresh wave of investor interest, particularly given the influence of social sentiment and historical trends on Dogecoin’s pricing.
Subscribe to our YouTube channel for daily crypto updates, market insights, and expert analysis.
We recommend eToro
Wide range of assets: cryptocurrencies alongside other investment products such as stocks and ETFs.
Copy trading: allows users to copy the trades of leading traders, for free.
User-friendly: eToro’s web-based platform and mobile app are user-friendly and easy to navigate.


