Kaspa (KAS) has been sliding for months, but some analysts believe the worst of the correction may already be behind it. The token reached a key technical zone where several indicators are beginning to line up.
Crypto analyst Finance Freeman shared a chart suggesting the Kaspa price may be close to forming a bottom. The setup combines Fibonacci levels, long-term trend support, and price movement inside a falling channel.
This does not guarantee an immediate rally, but the chart shows a structure traders often watch closely when a market is trying to stabilize.
Here’s What The Kaspa Chart Is Showing
The Kaspa price has touched the 0.886 Fibonacci retracement level, a high retracement level that is commonly found at major bottoms.
Kaspa’s price has also touched an area around $0.24, which is near the lower boundary of the descending channel and a long-term trendline that was established before Kaspa’s All-Time High.
When multiple technical levels converge to a single location, traders take notice. These areas sometimes act as strong support where selling pressure begins to fade. The chart suggests the market may need more time to stabilize before making its next major move.
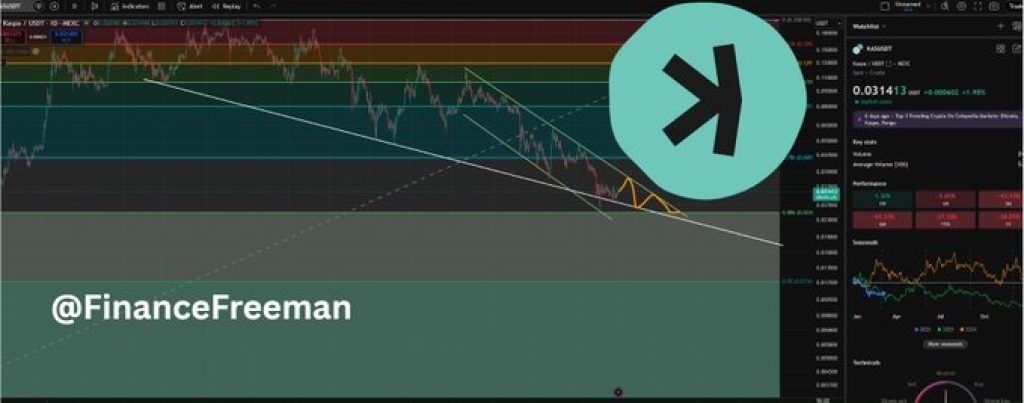
Finance Freeman also outlined a possible short-term path for Kaspa. On the chart, an orange path shows a scenario where the price moves sideways and forms a double bottom near the current support area.
This type of structure often appears when a market tests the same support level twice before reversing direction.
In this stage, the price movement may appear slow and choppy. The markets may be taking their time to digest the selling pressure, allowing the buyers to come back into the markets again. This, if the pattern develops correctly, may indicate that the downtrend is about to come to an end.
Read Also: Hedera Gets Adopted At Central Bank Level As HBAR Superior Technology Stands Out
What the KAS Chart Suggests for the Bigger Picture
After the possible double bottom forms, the analyst believes Kaspa could begin a larger move upward.
The long-term projection on the chart shows a path where the price could eventually move close to the $1 level. That would represent a huge increase from the current price range.
Of course, this type of scenario would take time and would depend on broader market conditions, continued growth in the Kaspa ecosystem, and stronger demand returning to the market.
For now, the most important level remains the $0.24 support zone. If that level holds, it strengthens the idea that the Kaspa price may already be building a base for its next cycle.
If the support fails, the market could still see further downside before a true bottom forms.
Subscribe to our YouTube channel for daily crypto updates, market insights, and expert analysis.