The basic principles of supply and demand drive the price action of any asset, including Bitcoin. Crypto analyst Ali (@ali_charts) emphasizes that when supply surpasses demand, prices tend to fall. Conversely, when demand exceeds supply, prices usually rise. On-chain metrics offer valuable insights into Bitcoin holders’ behavior, which is crucial for understanding future price action.
What you'll learn 👉
Bitcoin’s All-Time High and Subsequent Correction
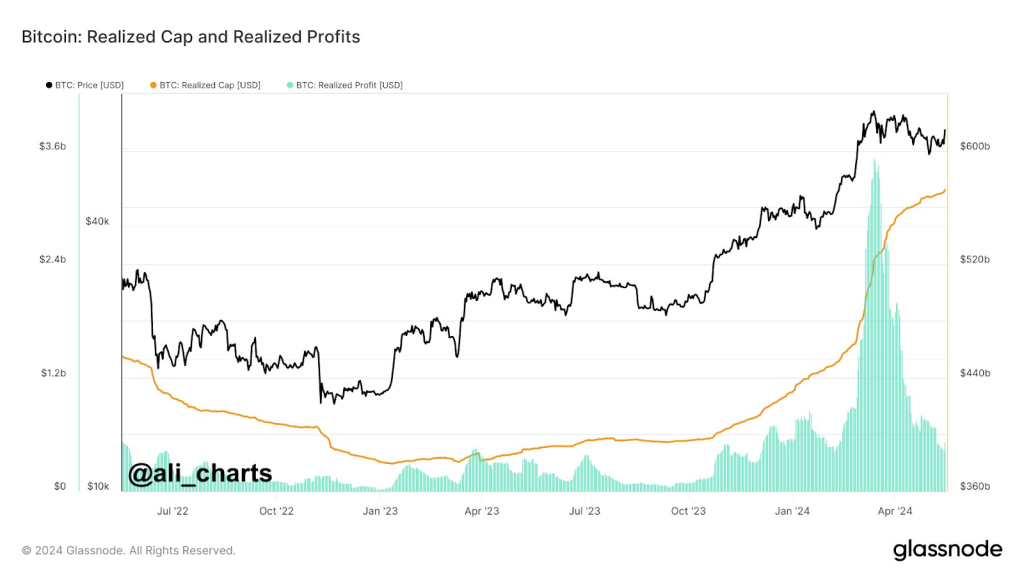
Bitcoin reached a new all-time high of over $73,000 in mid-March. This peak coincided with an increase in Bitcoin’s Realized Cap, indicating most long-term holders were in profit. Many of these holders sold their Bitcoin, resulting in a significant spike in Realized Profits.

The increased supply of Bitcoin in the market outpaced demand, leading to a price correction. Bitcoin’s value dropped below $57,000, falling below its Short-Term Holder Realized Price of $60,500. This created a sense of fear among short-term holders, who tend to sell during periods of volatility.
Doge2014 raises 500K in days celebrating Dogecoin. Make potentially big profits and get in on exclusive airdrop!
Show more +Read also: Chainlink Completes Test to Accelerate Fund Tokenization – LINK Price Prediction
Accumulation by Long-Term Holders
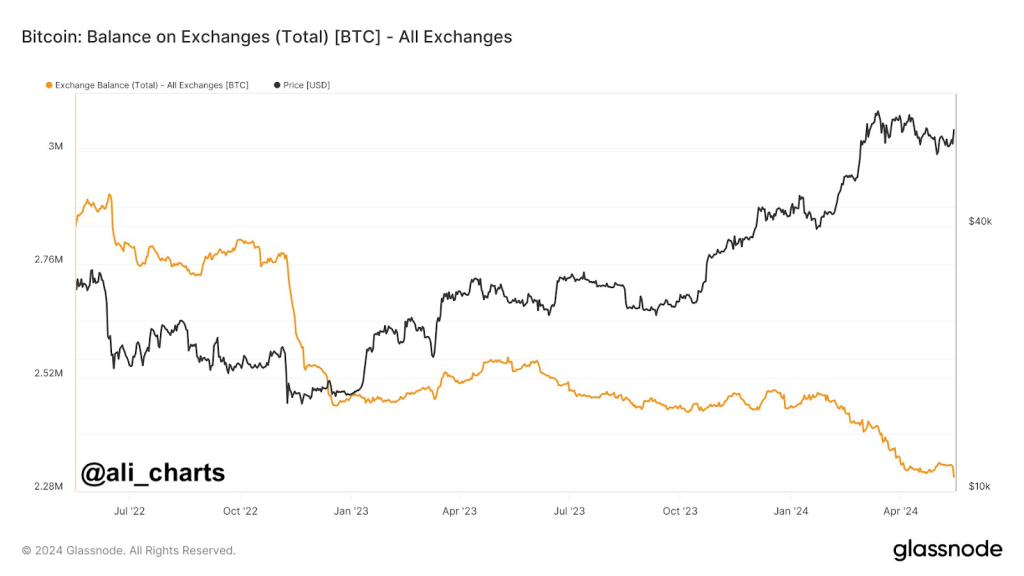
Despite the market’s apprehension, long-term holders viewed the price dip as an opportunity. They added more than 70,000 Bitcoin to their positions after realizing profits in March. This accumulation indicates confidence in Bitcoin’s future value. As demand for Bitcoin begins to outstrip supply, the chances of Bitcoin resuming its upward trajectory increase.
Since early May, over 30,000 Bitcoin moved from exchanges to private wallets for long-term holding. This shift shows confidence among holders in Bitcoin’s long-term value. The reduction in available supply on exchanges can support higher prices if demand rises.

Key Metrics and Future Price Action
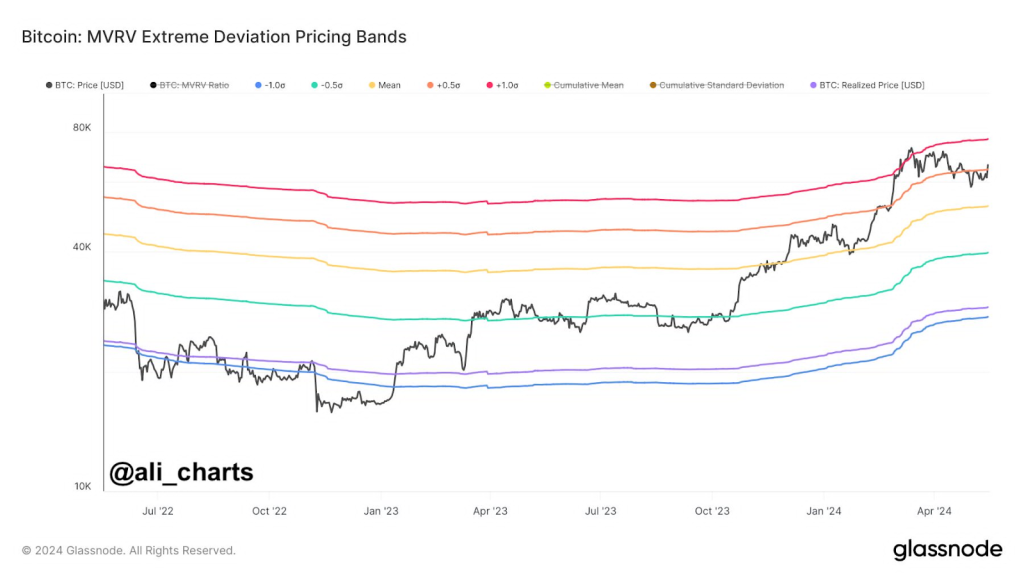
Forecasting the future price of any asset poses challenges. However, several on-chain metrics can provide hints about potential price movements. One important metric is the MVRV Extreme Deviation Pricing Bands. Recently, Bitcoin moved back above the +0.5σ pricing band, currently at $64,600.

Historically, such movements have led Bitcoin to test the 1.0σ pricing band, now around $77,000. This metric, furthermore, suggests that if demand continues to rise, Bitcoin could potentially reach this higher price level.
The interplay of supply and demand continues to shape Bitcoin’s price movements. Moreover, long-term holders’ accumulation, the transfer of Bitcoin to private wallets, and key on-chain metrics all suggest a potential price surge. Hence, these factors could lead Bitcoin to test the $77,000 level if demand outpaces supply.
Hunting for a small cap coin that could explode 10x? We’ve unveiled a few last week alone.
Get all our future calls by joining our FREE Telegram community.
We recommend eToro
Wide range of assets: cryptocurrencies alongside other investment products such as stocks and ETFs.
Copy trading: allows users to copy the trades of leading traders, for free.
User-friendly: eToro’s web-based platform and mobile app are user-friendly and easy to navigate.


