Conflux (CFX) Price Breaks Out of Key Zone – Here’s What This Analyst Says Could Happen Next

CFX price is picking up momentum again after breaking through a key resistance level. It’s up over 6% in the past 24 hours and trading around $0.1847.
Traders and analysts are now keeping a close eye on how the chart develops, especially around some important support zones that could shape where the price goes next.
On the daily chart, Conflux price managed to push back above the $0.1628 level with a strong bullish engulfing candle.
That’s usually seen as a solid sign of strength in an uptrend. Zooming in to the lower timeframes, the price action is starting to form a continuation pattern, something that often leads to another leg higher if momentum stays on track.
Meanwhile, market watchers like AT0m_B and Crypto Jobs are pointing out signs that bulls are stepping in across multiple timeframes.
What you'll learn 👉
Conflux Bullish Structure Forms After Breakout
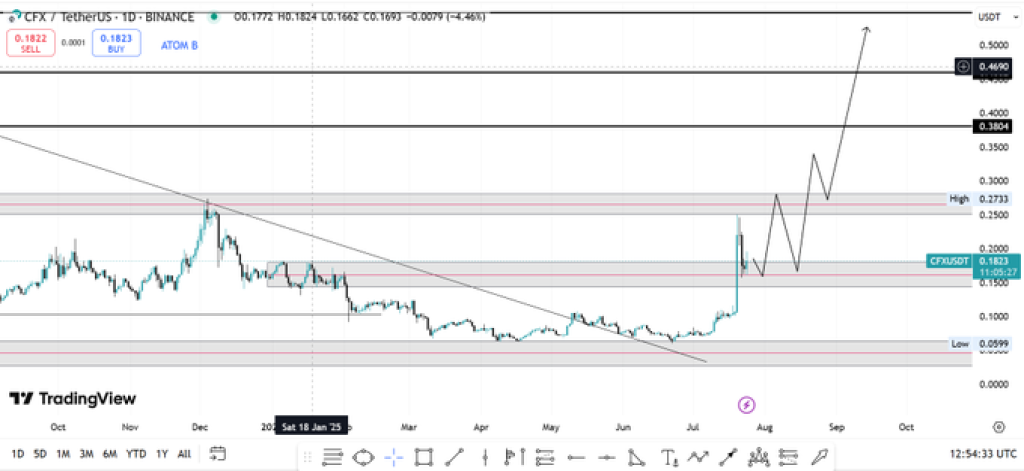
The daily chart shows that CFX price broke a long-standing downtrend line that extended back to Q4 2023. After this breakout, the price surged from around $0.10 to nearly $0.27 before correcting.
It is now consolidating just above the $0.1628 level, which has since become resistance turned support. This type of retest often signals continuation in bullish market structures.
The breakout candle that reclaimed $0.1628 was a bullish engulfing formation. This indicates a strong reversal and is often followed by higher price targets if supported by volume.
The next key resistance level is located at $0.2733, followed by longer-term levels at $0.3361 and $0.4490. A sustained move above these levels could open the door to the $0.83 zone, where profit-taking may occur according to some technical traders.
Read Also: Top Analyst Thinks 500 XRP Tokens Could Change Your Life: Here’s How
Furthermore, AT0m_B noted that short-term traders might look at lower timeframes for entry opportunities. A confirmed breakout above $0.2733 would, in his view, indicate renewed buyer momentum.
He also mentioned that the $0.4000 zone contains order blocks and fair value gaps, suggesting potential selling pressure there. For those aiming higher, $0.8300 is seen as a longer-term profit target. The tweet concluded with a cautionary note reminding readers to do their own research.
Read Also: Chart Shows SUI Is Set for Another Big Move: Here’s the Outlook
Lower Timeframes Show Continuation Setup For CFX Price
Analyst Crypto Jobs simply tweeted “$CFX – bullish 📈” alongside a short-term chart. The Conflux chart displayed a falling wedge forming after a recent breakout.
The current price action is sitting above a yellow support zone between $0.176 and $0.180. This area has been tested multiple times and has held as a short-term demand block.
$CFX – bullish 📈 pic.twitter.com/nbk7alaxOB
— 🧙 Crypto_Jobs🧙♂️ TA & FA 🎯 (@CryptoJobs3) July 24, 2025
Below this lies a green accumulation zone between $0.155 and $0.165, which previously served as a launch point for the breakout.
The projection in the CFX chart outlines a possible breakout to $0.217–$0.235 in the short term, aligning with previous reaction levels. A break above wedge resistance could confirm the start of the next leg higher.
Conflux Price Key Levels To Watch
CFX needs to stay above the $0.176–$0.180 support zone to keep with the current trend. To break above $0.2733 would likely be a sign of strength to higher levels of resistance.
If that move fails, downside targets include the green accumulation zone and, further below, the historical low at $0.0999.
Traders are watching both intraday and daily price structures, with the bullish setups offering clear validation levels and upside targets. Whether or not CFX price continues higher may depend on volume strength and follow-through from current buying interest.
Subscribe to our YouTube channel for daily crypto updates, market insights, and expert analysis.