
Bitcoin’s decline after the latest US inflation report has brought an uncomfortable question back into focus: how much further could the selling go? The report added pressure to an already fragile recovery, and the forecasts supplied from Claude AI and ChatGPT both identify important tests ahead.
Their answers share several key levels, although their deeper downside estimates differ. Both models also leave room for a recovery, provided Bitcoin can reclaim the price zones lost during the decline.
What you'll learn 👉
Why Bitcoin Crashed After the CPI Report
Bitcoin fell after the October 14 CPI release showed stronger inflation than markets expected. Higher inflation can increase expectations that the Federal Reserve will keep borrowing costs elevated or raise interest rates again.
The Bureau of Labor Statistics reported that September headline inflation reached 3.7% annually, up from 3.4% in August. Prices increased 0.6% monthly, and core CPI rose 0.3% monthly and 2.6% annually. These monthly and annual core readings measure different periods and should not be confused.
That distinction matters because the supplied AI responses describe some inflation figures differently. The official release provides the clearer reference point.
Higher borrowing costs can weaken demand for speculative assets. Bitcoin provides no guaranteed income, so higher yields elsewhere can also make competing investments more appealing.
The supplied market snapshots placed Bitcoin around $81,200 to $81,500 after the decline. Those readings put BTC close to the support area that dominates both forecasts.
What We Asked Claude AI and ChatGPT
Both models received the same task: analyze Bitcoin’s price action after the CPI decline and identify its support and resistance levels.
The prompt requested bullish, neutral, and bearish scenarios covering the next 7 to 30 days. Each response also needed price ranges, potential triggers, a realistic downside estimate, and a most likely outcome.
The comparison below examines those supplied responses. Their forecasts are conditional estimates, and agreement between the models does not independently validate a price target.
Claude AI’s Bitcoin Price Prediction
Claude’s central argument is that Bitcoin has reached the lower end of an existing trading range. Its response describes the CPI decline as pressure on support, rather than proof that a much larger breakdown has already started.
The model identifies $80,000 to $81,000 as the immediate support area. A sustained loss of that zone could expose $76,000 to $79,000, followed by deeper downside if selling accelerates.
Claude’s scenarios cover the following possibilities:
- Bullish: Bitcoin reaches $85,000 to $88,000, with a possible extension toward $90,000.
- Neutral: Bitcoin trades between approximately $78,500 and $84,500.
- Bearish: Bitcoin falls into the $72,000 to $78,500 range.
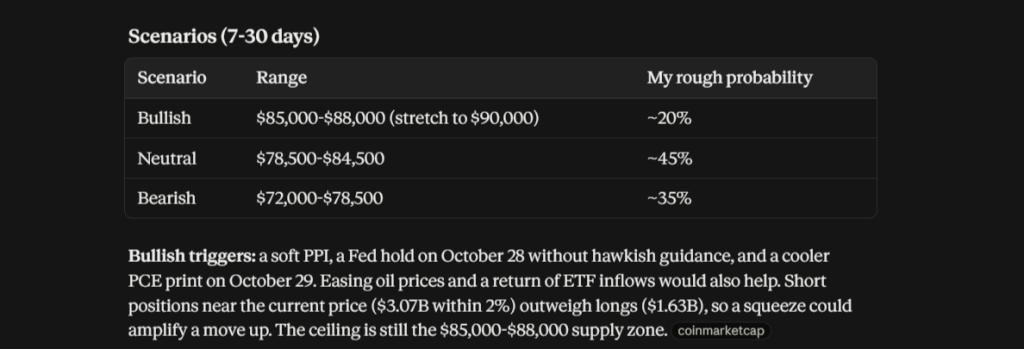
Its bullish case depends on softer economic data, less aggressive Federal Reserve guidance, and stronger demand through spot Bitcoin ETFs.
The bearish case requires more persistent pressure. Claude points to a daily close below $80,000, continued ETF withdrawals, or tighter monetary policy as potential triggers.
Claude favors the neutral scenario and assigns it a rough 45% probability. That percentage represents the model’s judgment, not a statistically established likelihood.
ChatGPT’s Bitcoin Price Prediction
ChatGPT also places $80,000 at the center of Bitcoin’s immediate outlook. Its response gives sellers the near term advantage because BTC was trading close to the bottom of its reported weekly range.
The model identifies $82,000 to $83,000 as the initial recovery hurdle. Its more important resistance area extends from approximately $83,800 to $85,000.
ChatGPT separates its forecasts into 7 day and 30 day periods:
| Scenario | Next 7 Days | Next 30 Days |
|---|---|---|
| Bullish | $83,000 to $86,500 | $85,000 to $90,000 |
| Neutral | $79,500 to $84,000 | $78,000 to $85,000 |
| Bearish | $75,000 to $80,000 | $70,000 to $77,000 |
The bullish scenario requires buyers to defend support, recover $83,000, and establish a stronger position above $85,000.
Its bearish path begins with a sustained breakdown below $80,000. Further losses through $77,000 and $75,000 would make the deeper forecast more credible.
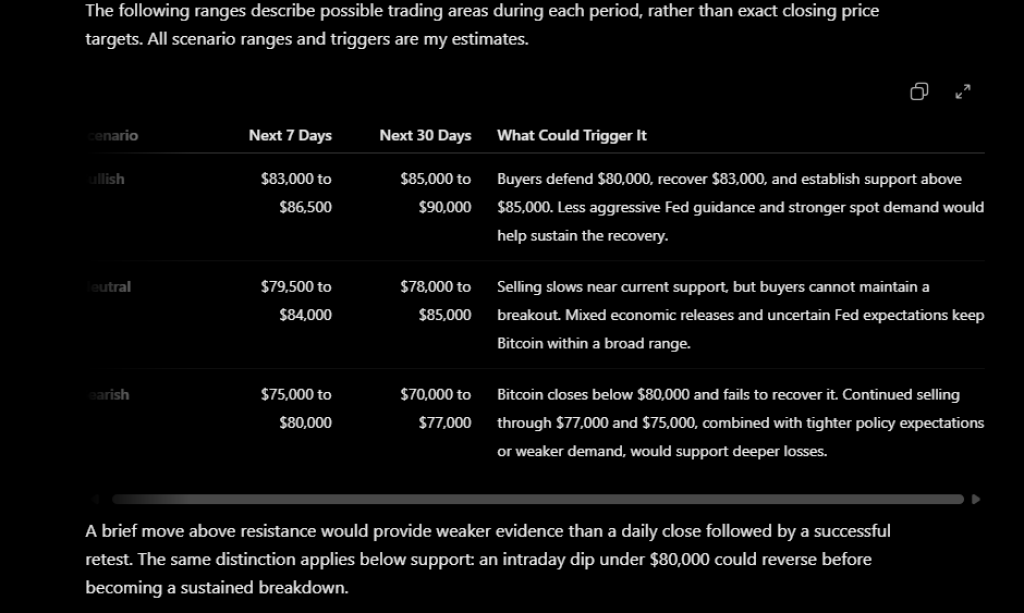
ChatGPT’s preferred outcome remains the neutral scenario with a downside bias. That means uneven recovery attempts and possible temporary losses beneath support, rather than an uninterrupted decline.
Where Both AI Models See the Biggest Downside Risk
Both forecasts identify the loss of $80,000 as the most important immediate danger. Their concern becomes more serious if Bitcoin breaks below that level and then fails to recover it.
A temporary dip would provide weaker evidence. Buyers could reverse an intraday decline before it develops into a sustained breakdown.
The forecasts overlap around the upper $70,000s, but their stress estimates differ:
| Downside Stage | Claude AI | ChatGPT |
|---|---|---|
| First Lower Area | $76,000 To $79,000 | $77,000 To $79,000 |
| Deeper Downside | $72,000 To $74,000 | Around $75,000 |
| Severe Stress Extension | Below $70,000 Requires More Deterioration | $70,000 To $72,000 |
These are potential destinations under worsening conditions. Neither response establishes a guaranteed floor beneath Bitcoin.
Could $78,000 Become the Next Bitcoin Support?
The $78,000 level falls inside the lower trading areas identified by both models. That makes it a useful reference if Bitcoin loses $80,000.
Claude places it within a broader $76,000 to $79,000 zone. ChatGPT includes it within both its lower support candidate and its neutral monthly range.
However, a forecast cannot turn a price level into confirmed support. Bitcoin would need to demonstrate buying demand there through repeated defenses or a recovery after an initial test.
The reaction after a bounce would also matter. A recovery that fails beneath $80,000 could leave sellers in control, even if $78,000 temporarily slows the decline.
Read Also: XRP Price Crashes Below $1.30 – How Low Can XRP Go?
What Would Invalidate the Bearish Scenario?
Bitcoin reclaiming $83,000 would weaken the immediate bearish argument, but a stronger recovery would require more.
Both forecasts place greater importance on the $84,000 to $85,000 area. Sustained trading above that band would challenge the expectation that recovery attempts will keep failing.
Several developments could support that outcome:
- Bitcoin holds above $85,000 after a breakout and subsequent retest.
- Federal Reserve guidance becomes less restrictive than markets had feared.
- Spot demand improves and ETF flows provide more consistent support.
A move toward $87,000 to $88,000 would further weaken the immediate breakdown case. However, an isolated price spike would offer less convincing evidence than sustained trading above resistance.
Our Take: How Low Could Bitcoin Realistically Fall?
The supplied forecasts make the upper $70,000s the clearest initial downside area if $80,000 fails. A move toward $75,000 becomes more plausible if recovery attempts repeatedly lose strength.
The $70,000 to $74,000 region belongs to a more severe scenario. Reaching that area would require additional deterioration, such as persistent selling, weaker demand, and more restrictive financial conditions.
Our most likely outcome is volatile trading around support, with recovery attempts struggling beneath $85,000. That broadly matches both models’ neutral forecasts without treating their agreement as proof.
Subscribe to our YouTube channel for daily crypto updates, market insights, and expert analysis.