Stellar price is back in focus after a clear breakout on the four hour chart. Crypto analyst Ali, known as @ali_charts, says the move unlocks a path to $0.75. He points to a bullish flag that formed after a strong leg up in July and argues that the breakout confirms renewed momentum.
His tweet is short and direct. “Stellar $XLM targets $0.75 after breaking out of a bullish flag.” The idea is simple. A strong impulse up, a tidy consolidation, then a clean break that often resumes the prior trend.
What you'll learn 👉
What Ali’s Chart Is Showing For XLM
Ali’s chart uses the XLM to USD pair on Coinbase with a four hour timeframe. The first thing that stands out is the sharp climb from late June into mid July. That run creates the flagpole. XLM price then slides inside a downward channel that looks like a tidy flag or even a falling wedge.
The upper boundary of that channel connects a series of lower highs. The lower boundary connects lower lows with shrinking momentum. This is the consolidation phase.
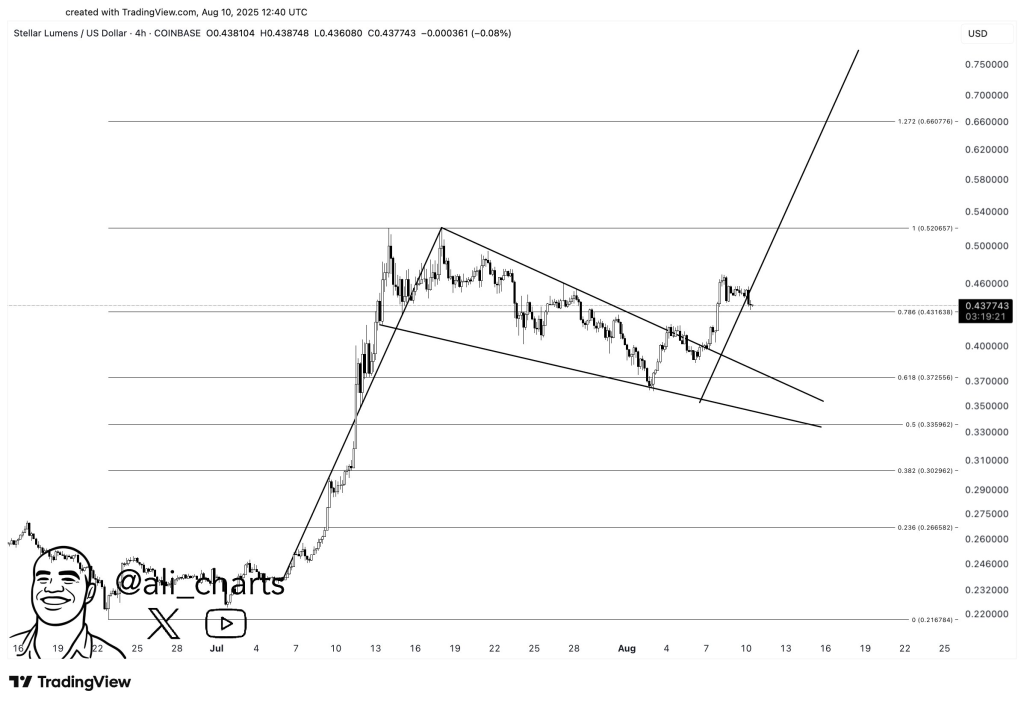
Fibonacci retracement lines sit across the whole move to show where buyers stepped in. The 0.618 line is shown near $0.37 and the 0.786 line is near $0.42. XLM price respected these areas during the consolidation. It dipped toward the 0.618 region, bounced, and then pressed through the upper trend line of the flag. That breakout level sits around the low to mid $0.40s on the chart.
Right after the breakout, Ali marks a small pause near $0.45. This is typical. Markets often retest the breakout area to confirm it as new support. On the chart, that retest lines up with the 0.786 retracement near $0.42 to $0.44. Buyers show up again and push price away from the broken trend line. The structure says the corrective phase ended and the next leg of the prior uptrend can begin.
How Ali Gets to $0.75 for Stellar Price Projection
Targets in a flag breakout often come from the height of the flagpole projected from the breakout point. Ali’s view aligns with that logic. He also plots Fibonacci extensions above the prior high. The 1.0 extension sits near $0.52. The 1.272 extension shows up around the mid $0.60s. His projection line continues to the $0.75 area, which is a round number and a reasonable extension of the July move.
The path looks like this on his chart. Hold above the broken flag line. Clear the prior swing high around $0.50 to $0.52, which is near the 1.0 extension. Stretch into the $0.60s around the 1.272 extension. If momentum persists, overshoot into the $0.75 region.
That last push often comes when a breakout gathers attention and volume. In short, the market has turned from defense to offense and has room to run if buyers keep control.
Ali repeats the core message in his tweet and in the chart. The setup is a textbook bullish flag. The breakout already happened. The levels above are mapped. He is not claiming a guarantee. He is laying out a scenario that follows common chart logic.
Read Also: XRP Price Prediction for Today (August 12)
What to Watch Next for XLM Price
Ali’s case rests on two simple checkpoints. First, the breakout area around $0.42 to $0.45 should act as support on dips. If price keeps closing above that zone on the four hour chart, the structure remains healthy. Second, the market needs to reclaim and hold above the July high near $0.52. That would confirm higher highs and keep the flag target in play.
If Stellar price loses the breakout zone and falls back inside the old channel, the signal weakens. A deeper drop toward the $0.37 Fibonacci level would tell traders that the flag failed and the market needs more time. Ali’s tweet does not dwell on invalidation, but the chart makes it easy to see where the idea breaks down.
Subscribe to our YouTube channel for daily crypto updates, market insights, and expert analysis.