When traders talk about demand zones, they usually point to areas where big players quietly step in before a strong move. SEI price just bounced from that kind of level, and the reaction could be catching attention.
SEI price traded in a tight range between $0.26 and $0.29 at the start of September.The rebound from this zone now raises the question: could this be the start of a larger rally that pushes SEI toward its next target?
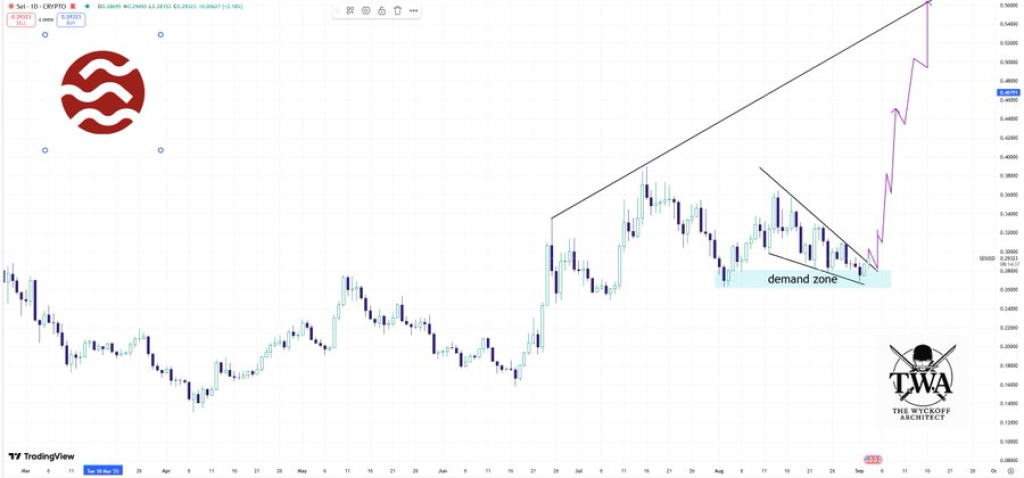
The Wyckoff Architect, a crypto page on X, mapped a clean zone where buyers stepped back in. Charts often read like stories told in chapters. First came a strong advance that pushed SEI to new highs.
Then came a cool-off period, pulling price back into the demand zone. Inside that correction, the candles built a falling wedge pattern with lower highs pressing against steady support. Breakouts from wedges usually move with speed once sellers run out of strength.
If SEI closes above the wedge line, that would be an early sign of momentum returning. A successful retest would confirm strength and align with The Wyckoff Architect’s view of a multi-time frame setup still favoring the upside.
Detailed Breakdown Of The Wyckoff Architect Chart
The chart shared by The Wyckoff Architect notes three key elements. A blue demand zone marks the base where SEI consistently found support. A descending line across recent lower highs forms a wedge pattern that often precedes breakouts.
A broader ascending line connects earlier highs, serving as an overhead guide for where price could face supply again. The magenta projection sketches a possible breakout sequence: a push through the wedge, a retest that holds above it, and a drive higher toward the top boundary of the larger structure. This visual roadmap captures both the buildup and potential breakout path.
Confirmation comes step by step. A daily close above the wedge line would signal that sellers have lost control of the pullback. Strong follow-through candles would show fresh momentum.
Read Also: September Setup: Here’s What to Expect from Ripple (XRP) Price in the Coming Weeks
If price retests the wedge line or the demand zone and holds, it reinforces the bullish structure. Finally, taking out swing highs would shift the market tone from corrective to impulsive, building the case for SEI’s next leg upward.
Subscribe to our YouTube channel for daily crypto updates, market insights, and expert analysis.