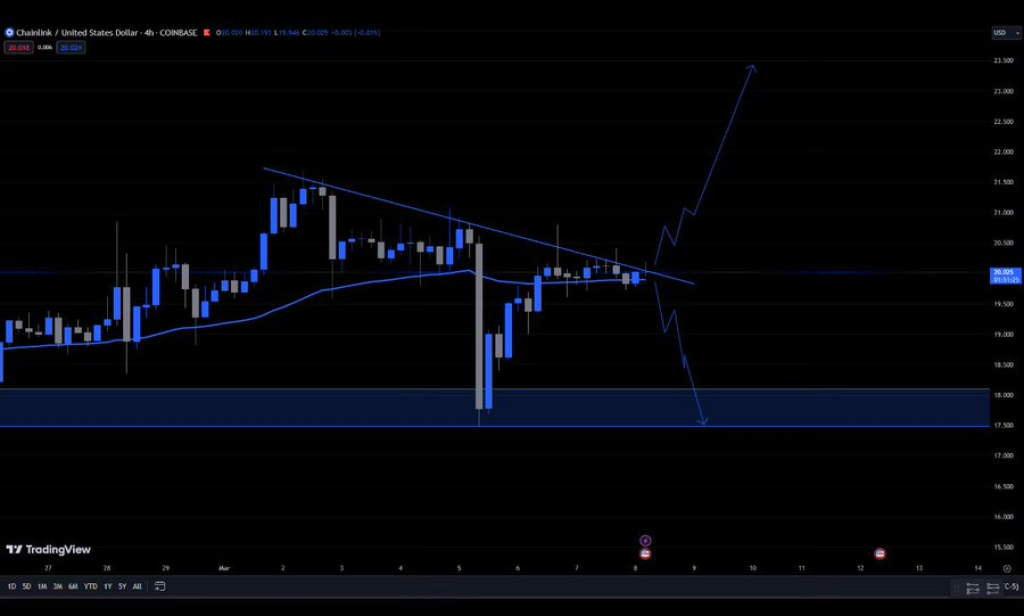
According to the analysis from @SameDayTrades, LINK is currently stuck between a rock and a hard place, with the trendline acting as resistance and the 50 Exponential Moving Average (EMA) serving as support.
The analyst believes that regardless of the direction in which LINK breaks out, the move will be significant, potentially resulting in a multi-dollar price change. This observation highlights the importance of monitoring key technical levels and being prepared for substantial price movements in either direction.

Based on the chart provided by the analyst, the price of LINK is attempting to break through a descending trendline. A successful breakout above the $20 level could potentially trigger a significant upward price spike. Conversely, a break below the 50 EMA could result in a major downward price movement.
To provide further insights into the LINK price action, altFINS, a crypto analytics firm, has conducted an analysis that sheds light on the key levels to watch and the overall trend of the asset.
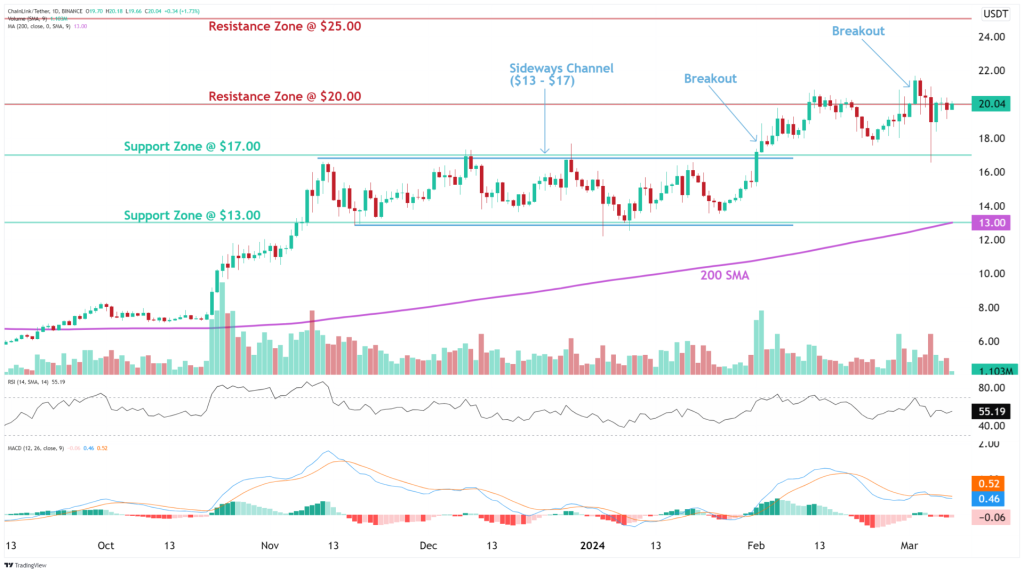
According to altFINS, LINK is exhibiting bullish signals across all timeframes, suggesting potential upside potential. The analysis highlights that after consolidating in a sideways channel between $13 and $17 for three months, the price broke out from the channel and surpassed the $20 resistance level. This breakout is considered a signal for the continuation of the uptrend, with a potential upside of around 20% towards the $25 level.
Doge2014 raises 500K in days celebrating Dogecoin. Make potentially big profits and get in on exclusive airdrop!
Show more +Currently, the price of LINK is retesting the breakout level, making it a crucial juncture for traders and investors. altFINS recommends setting a stop-loss at $18.30 and suggests placing a price alert to monitor the price action closely.
Interestingly, Chainlink (LINK) was the research coin pick by altFINS, and since their initiation report in August 2023, LINK has surged by an impressive 170%. The analysts attribute this performance to Chainlink’s position as a leading oracle data provider, which could benefit from the long-term trend of tokenizing real-world assets (RWAs) like US T-Bills.
In terms of technical analysis, altFINS highlights that LINK is in an uptrend across all time horizons (short-term, medium-term, and long-term). However, the momentum indicators are mixed, with the Moving Average Convergence Divergence (MACD) Line below the MACD Signal Line (bearish signal) and the Relative Strength Index (RSI) hovering around 50 (neutral signal).

The key levels to watch, according to altFINS, are as follows:
Support Levels:
- Nearest Support Zone: $17.00 (previous resistance)
- Secondary Support: $13.00
Resistance Levels:
- Nearest Resistance Zone: $20.00
- Next Resistance: $25.00
In conclusion, Chainlink’s LINK token finds itself in a precarious position, caught between a rock and a hard place. Traders and investors alike are eagerly awaiting a decisive breakout, which could potentially trigger a multi-dollar price move. By closely monitoring the key technical levels and considering the analysis from reputable sources like altFINS, market participants can make informed decisions and position themselves accordingly for the potential price movements of LINK.
You may also be interested in:
- Fantom (FTM) Sees Significant Uptick in Whale Transactions and Market Sentiment Which Could Continue to Surge Price Higher
- SEI Token on the Verge: Analyst Predicts Surge to This Next Price Level, But There’s a Catch
- BlockDAG Presale In Full Swing Raises Above $3M In Presale Amid Chainlink and TRON Price Surges
We recommend eToro
Wide range of assets: cryptocurrencies alongside other investment products such as stocks and ETFs.
Copy trading: allows users to copy the trades of leading traders, for free.
User-friendly: eToro’s web-based platform and mobile app are user-friendly and easy to navigate.


