Chainlink has been grinding sideways for a while, bouncing between highs and lows without a clear direction. That kind of movement could frustrate investors, but it also builds pressure beneath the surface.
According to Ali, a chart analyst on X, this long period of consolidation may finally be reaching its breaking point. His view is simple: if LINK price dips toward $16, that could mark one of the best buying opportunities before a potential rally that stretches as high as $100.
The reasoning comes from a massive triangle pattern on the chart, which often signals a big move when price finally breaks out.
What you'll learn 👉
LINK Price Setup Explained From Ali’s Triangle And What It Shows
The chart draws two clear lines that squeeze price into a point. One line slopes down from the 2022 highs and acts as a long term ceiling. Another line climbs up from 2022 lows and gives steady support. That meeting point sits near $22 and makes each swing feel more meaningful.
Fibonacci bands run across the frame and the dotted projection on the chart steps up toward $100 after a breakout. Ali’s read treats the triangle as a compression that can release energy if Chainlink clears its falling resistance.
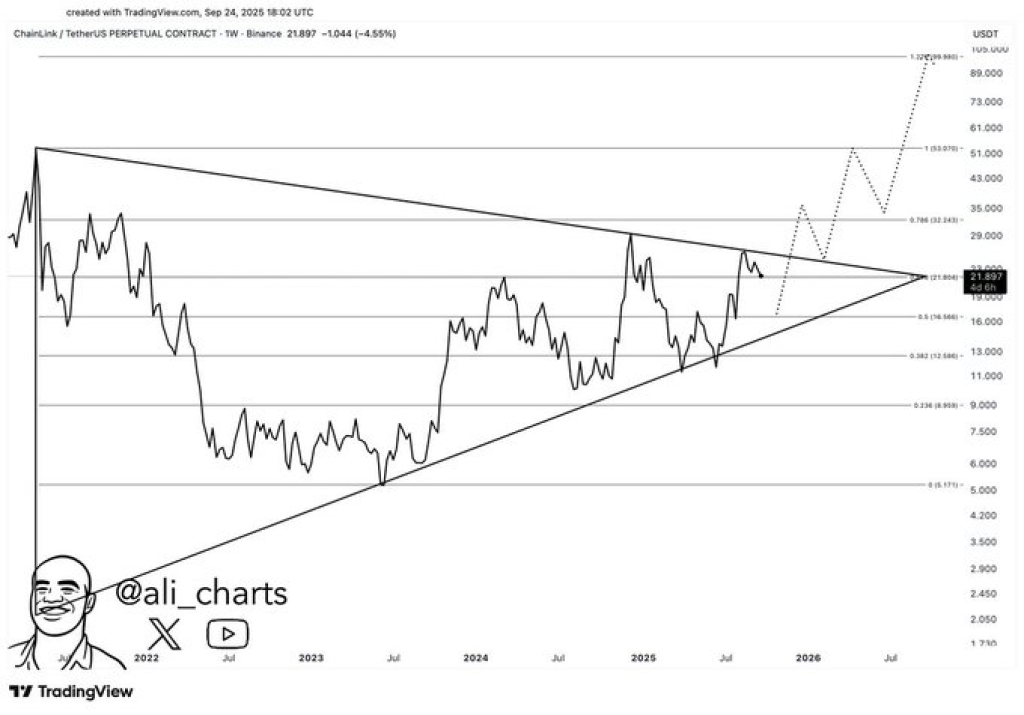
Ali’s post points to $16 as a possible landing spot before the real breakout. That level touches the lower boundary of the triangle, meaning a dip there could set the stage for a strong rebound. From $16 to $100 is about a 6x move, which explains why he frames it as a “gift” level.
The structure suggests that if buyers defend support, the upside runway becomes much larger. This isn’t a promise but rather a way of mapping risk and reward using chart patterns.
LINK Token Upside Targets And How The Chart Maps A Path To $100
The dotted path on Ali’s chart reads like a staged climb. First test after a breakout could land near a midrange area around $35. Continued momentum might push Chainlink toward $50 as a confirmation leg. A sustained move with healthy volume could then aim at a $100 zone as a longer term target.
That staircase view lines up with common technical reactions where old resistance becomes new support before price tries for a much higher target. Chart structure matters here since the triangle stores potential that usually resolves with a strong directional move.
Chainlink Risk Factors And Why A Failure Matters
A failed breakout that quickly rolls back below the downtrend would trap momentum and raise risk of further pullback. Volatility around macro events can make price jump or drop without respect for neat patterns.
Read Also: XRP Bullish Pattern Repeats: Why $33 Could Be the Next Major Price Target
Liquidity and wider market mood also influence whether a breakout becomes a real rally or a short lived pop. Ali’s suggestion of a dip to $16 implicitly acknowledges room for downside before an upside run. That kind of framing helps see both sides rather than only focusing on a $100 outcome.
Subscribe to our YouTube channel for daily crypto updates, market insights, and expert analysis.