Looking at the weekly chart, the structure on LINK becomes pretty clear. What we are looking at is a classic head-and-shoulders pattern that has been forming since 2024.
The left shoulder took shape in the low to mid $20s, then LINK price pushed higher to form the head near the upper $20s, and after that, the right shoulder rolled over again around similar levels.
What really stands out here is the neckline. It is not flat, but slightly rising, and it comes in right around the $10 to $11 zone. That is why the LINK price is now sitting at such a sensitive level. This is not just another support. It is the level that decides whether this entire structure breaks down or not.
Why $10–$11 Is Critical For LINK, With Lower Levels Below
CryptoBullet’s main message is simple and hard to argue with. If the LINK price loses the $10–$11 support area on a weekly close, things can turn ugly quickly. On a chart like this, a weekly close matters far more than a random wick or a quick dip.
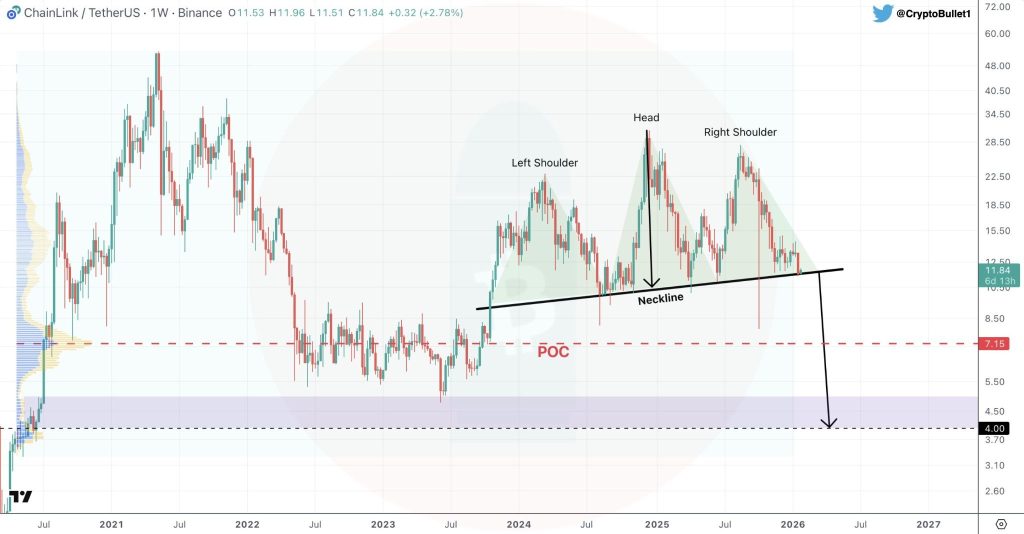
Just below that, around $7.15, sits what he calls the conservative downside target. This level is not picked randomly. It lines up with the volume point of control and with the accumulation zone from 2022 and 2023. In other words, this is where LINK previously spent a lot of time trading, so if price starts sliding, that zone naturally becomes the next place the market looks toward.
If the head-and-shoulders plays out fully, the measured move points toward the $4–$5 area. That is the deeper target mentioned in the tweet, and it matches the lower demand zone visible on the chart.
Getting to that level would depend on a general softness in the crypto space, not necessarily on LINK being lagging on its own. Nonetheless, it does provide a roadmap as long as sellers are in charge.
What Needs To Happen To Avoid This Breakdown
For this bearish setup to lose its grip, the LINK price needs to hold the $10 to $11 area and start building higher lows from there. Even better would be a clean reclaim and move back above the right shoulder zone, which would start to invalidate the pattern entirely.
Until that happens, the chart is very straightforward. The LINK price is sitting right on the line that separates a messy consolidation from a full weekly breakdown, and the next few weekly closes will likely decide which side wins.
Read Also: Why Chainlink’s CCIP Is Turning LINK Into a Financial Infrastructure Play
Subscribe to our YouTube channel for daily crypto updates, market insights, and expert analysis.