While the crypto narrative has been dominated recently by Bitcoin’s all-time high and the surge in meme coins and AI tokens, Chainlink (LINK) has seen a more muted price action over the past few weeks. LINK has been trading in a range between $17-$20, consolidating after a strong start to the year.
However, for long-term LINK investors, the subdued price movement has done little to shake their conviction. Chainlink’s strong fundamentals as the leading decentralized oracle network make it a compelling long-term hold in the crypto space.
What you'll learn 👉
Technical Analysis Signals Potential Upside
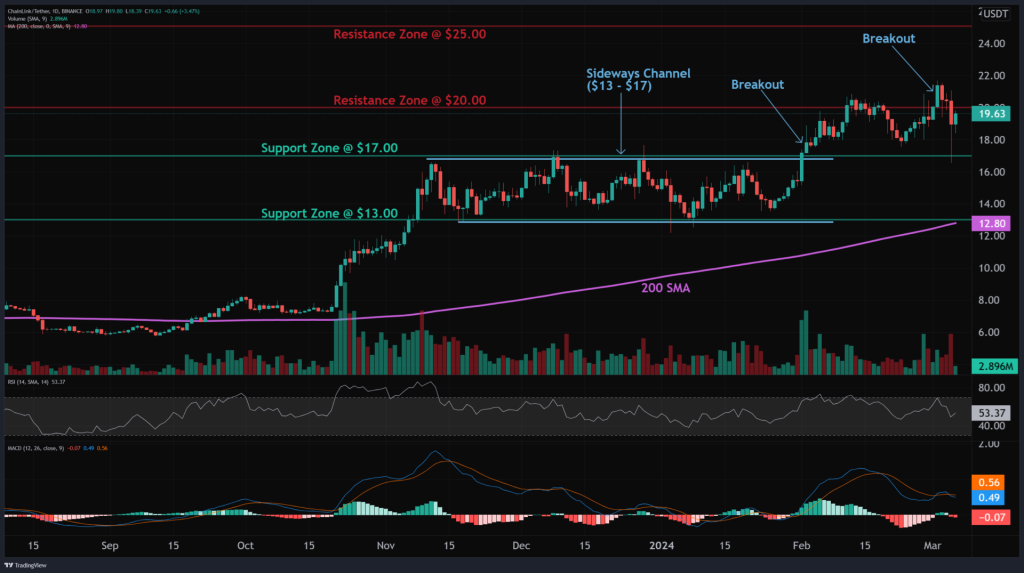
A look at the technical analysis from altFINS shows LINK’s price breaking out from a multi-month sideways channel between $13-$17 in mid-February. The decisive move above the $20 resistance suggests a continuation of the uptrend, with a potential 20% upside toward the $25 level.

While the price is currently retesting the breakout zone, a stop loss can be set at $18.30 to manage risk. As a leading oracle solution facilitating the tokenization of real-world assets like U.S. T-Bills, Chainlink is well-positioned to benefit from this burgeoning trend.
Mixed Momentum Indicators but Overall Uptrend Intact
Examining the momentum indicators provides further insights. The Moving Average Convergence Divergence (MACD) shows a bearish signal as the MACD line is below the signal line. However, the Relative Strength Index (RSI) is neutral at around 50, suggesting the potential for a continuation of the uptrend.
Doge2014 raises 500K in days celebrating Dogecoin. Make potentially big profits and get in on exclusive airdrop!
Show more +The MACD is a trend-following momentum indicator that shows the relationship between two moving averages of an asset’s price. When the MACD line crosses below the signal line, it can signal a potential bearish shift in momentum. Conversely, a crossover of the MACD line above the signal line is considered a bullish signal.
The RSI is a momentum oscillator that measures the speed and change of price movements. Traditionally, an RSI reading above 70 is considered overbought, while a reading below 30 is oversold. In LINK’s case, the neutral RSI around 50 suggests a balanced market with room for potential upside.
Key Support and Resistance Levels to Watch
In terms of key levels, LINK’s nearest support zone is at $17.00, which previously acted as resistance. A more significant support lies at $13.00, the lower bound of the previous sideways channel. On the upside, the immediate resistance is at $20.00, followed by the $25.00 target projected by the recent breakout.
Conclusion
While the broader crypto market has been captured by other narratives, Chainlink’s solid fundamentals and position as the leading oracle solution continue to make it an attractive long-term holding for investors. The recent price consolidation presents an opportunity for those looking to accumulate LINK, with technical analysis suggesting potential upside toward the $25 level in the coming period.
As always, proper risk management through stop losses and monitoring of key support and resistance levels is crucial.
We recommend eToro
Wide range of assets: cryptocurrencies alongside other investment products such as stocks and ETFs.
Copy trading: allows users to copy the trades of leading traders, for free.
User-friendly: eToro’s web-based platform and mobile app are user-friendly and easy to navigate.


