
LINK price surged over 6% in the past day, and has gone into a critical chart region that has drawn attention from traders.
The move comes amid broader market activity and follows a tweet by CryptoED, who pointed to institutional support and an imminent rally.
According to the analyst, Chainlink ongoing partnerships may be aligning with the technical setup, suggesting a potential shift in momentum.
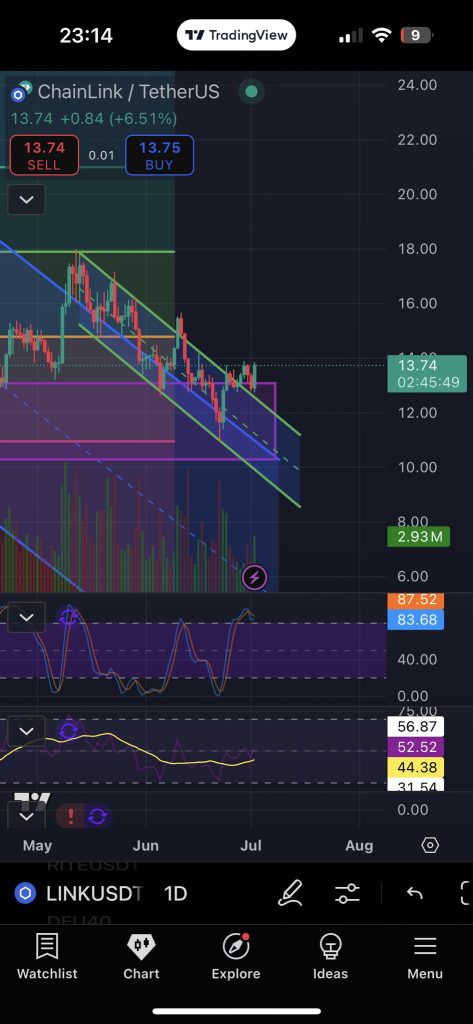
The LINK price pair was trading at $13.74 at the time of writing, with a tight spread between buy and sell orders. The price action marks a bounce off previous lows and positions the token at a major decision point on the daily chart.
What you'll learn 👉
LINK Testing Resistance After Prolonged Channel
Since early June, LINK price has traded within a descending channel marked by lower highs and lower lows. The current structure includes clear green boundaries, indicating well-respected trendlines.
Price just rebounded from the lower end of the channel and is now at the upper resistance of $13.70-$13.80.
This zone is still significant for bulls to confirm a trend change. A breakdown higher may indicate a change in sentiment and expose the next level of resistance at $15.00 to $16.00.
Volume has picked up alongside this move, also showing renewed interest in the asset as it nears this decision level.
LINK Price Analysis: Support and Demand Zones Remain Intact
The lower end of the chart shows a demand zone between $11.00 and $12.00, which held firm through prior sell-offs.
This region is backed by multiple candlestick wicks and steady volume, and is forming a base for the current uptrend. Lower down, the general support zone from $10.50 to $11.50 continues to hold.
In case the LINK price is unable to break out above the resistance, traders can aim for these levels to establish potential re-entries. Any rejection from the current level could lead to a retest of the $12.00 area, which previously showed strength.
Indicator Readings Signal Strength
The daily Stochastic RSI reading near 84 shows LINK price in overbought territory. This suggests upward momentum, though it may pause if buyers lose steam.
The RSI value is around 52.52 and has moved above its average, which stood at 44.38. This upward crossover supports the bullish price structure.
Momentum indicators suggest that LINK may be entering a transition phase. Traders are now watching for confirmation through a daily close above the current channel line to validate a sustained move.
Read Also: AI Predicts Chainlink (LINK) Price When Bitcoin Price Hits $200K
Analyst Commentary Adds Context
Crypto analyst CryptoED expressed a bullish view on LINK price, and stated that the “next leg is loading.” The tweet referenced Chainlink’s collaborations with large institutions, a point often raised in connection with its long-term adoption narrative.
This view aligns with current technical conditions. While no breakout has occurred yet, the combination of chart structure, indicator positioning, and trading volume has brought LINK into focus among market participants monitoring mid-cap altcoins.
Subscribe to our YouTube channel for daily crypto updates, market insights, and expert analysis.