
Chainlink has been moving inside a triangle pattern since late 2024. If you look at the recent chart, you’ll see how the LINK price has been squeezed between a descending resistance line from the highs near $30 and a rising support trendline from the lows around $8. This structure has created a narrowing triangle that the price has been bouncing inside for months.
Although Chainlink showed some bullish momentum over the past two days, today’s candle reveals signs of exhaustion among buyers. LINK has dropped about 5% so far, which suggests that sellers are pushing back at this resistance.
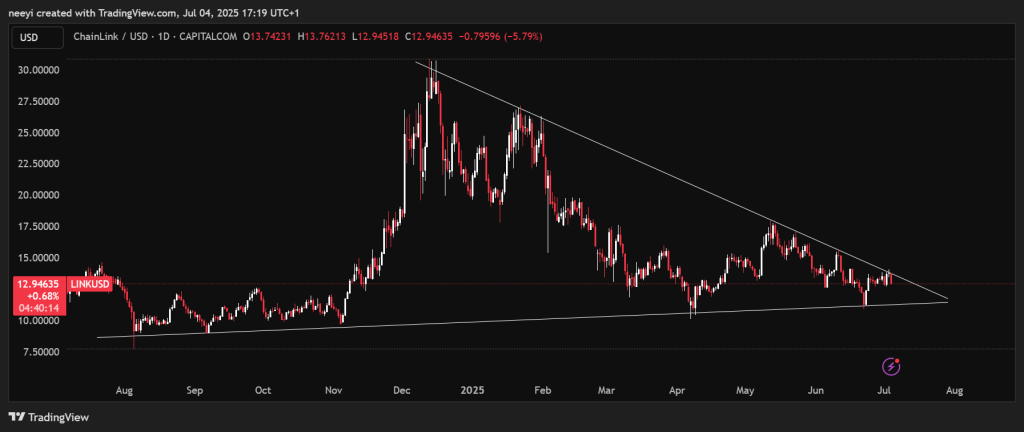
If this bearish pressure continues, we could see Chainlink price fall back toward the lower trendline of the triangle, which would mean around a 15% drop from where LINK is trading now at about $13.
Despite this short-term weakness, the support line has been reliable since August 2024. Every time the price approached this trendline in the past year, it found strong buying interest that pushed it back up. That means there’s still a good chance the support could hold again if the price drops that far.
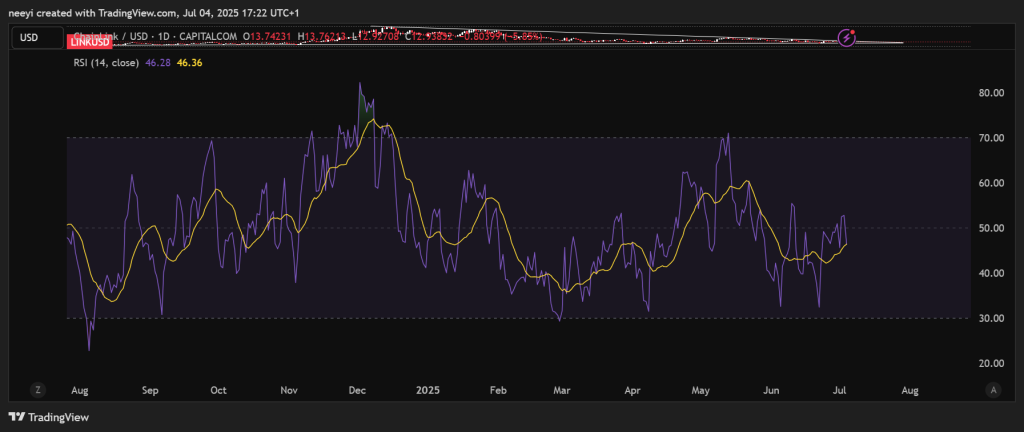
The Relative Strength Index, or RSI, is hovering at around 46. This indicates a neutral momentum for LINK. It is neither in overbought nor oversold territory, so the Chainlink price could realistically go in either direction depending on which side of the triangle breaks first.
Read Also: Why Investing $1,000 in Onyxcoin (XCN) Right Now Could Be a Bad Move
Analyst Spots Key Barrier for LINK Price
Meanwhile, analyst Ali shared a chart analysis on X that highlights a major resistance level traders should watch closely. According to him, the key level for Chainlink is $15.30. If the LINK price can break and close above this resistance, it would signal a potential start of a new rally. Such a breakout could open the way for Chainlink price to set higher highs beyond the triangle pattern and possibly return to its previous peaks.
One key resistance level to watch for Chainlink $LINK is $15.30, breaking above it could open the door to higher highs! pic.twitter.com/sr0jtZ8jcb
— Ali (@ali_charts) July 4, 2025
This level at $15.30 lines up with the descending trendline that has been capping LINK’s price since it topped near $30. So, until there’s a decisive move above that resistance, the price is likely to keep trading sideways within the triangle.
Subscribe to our YouTube channel for daily crypto updates, market insights, and expert analysis.


