Chainlink (LINK) Signals Suggest Price Is Stabilizing: Spike to $23 Re-Enters the Conversation

Chainlink (LINK) price has declined for 2 weeks now, but it looks like the price is beginning to see life again as it has increased by around 30% in the last three days.
A chart shared by crypto analyst Cihan Türkmen on X breaks down why Chainlink appears to be entering a calmer phase after a sharp drop. The visuals tell the story clearly: LINK is now attempting to establish a floor between $13 and $14.
What you'll learn 👉
Chainlink Price Steadies After Heavy Selling
Cihan Türkmen points out that the $13 to $14 area has acted as a battleground several times. The chart reflects this perfectly. Each time LINK slides into this zone, price reactions become slower, candles tighten, and buyers attempt to reclaim control. Current market behavior mirrors those earlier phases, suggesting that Chainlink is searching for balance again.
The RSI has begun curling upward after brushing oversold territory. Cihan notes that this forms bullish divergence, and the chart confirms it with higher lows showing on the indicator while price tested the same zone repeatedly. MACD also remains locked in a positive crossover, offering additional support to the idea that momentum is shifting.
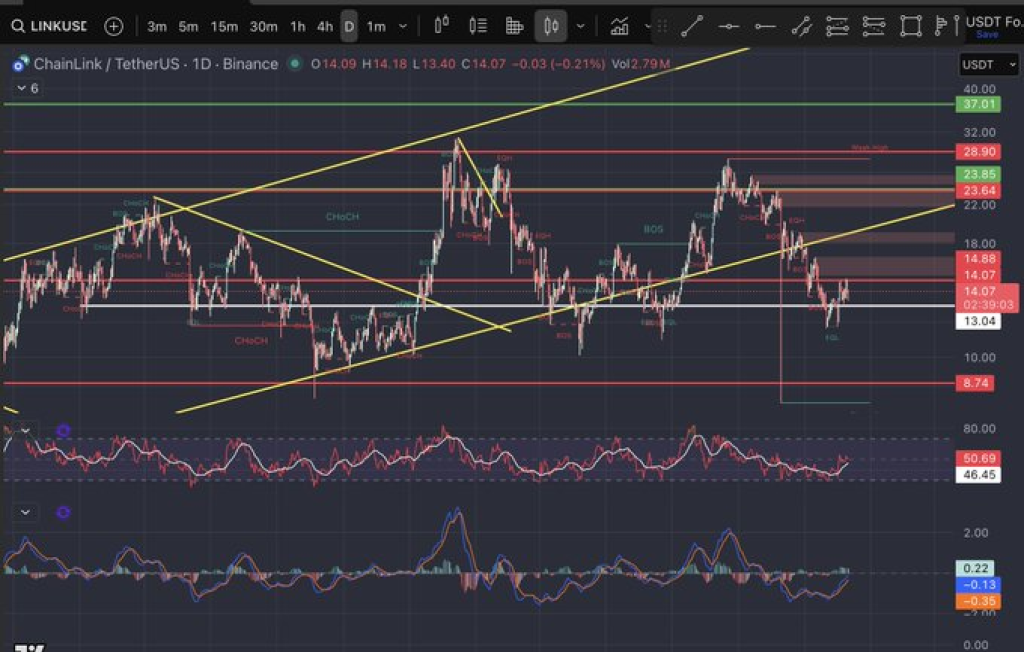
Horizontal levels on the chart show how dominant the $14.80 region has been. Price has touched this zone several times, sometimes getting rejected instantly, sometimes lingering before sellers step in. A daily close above it would shift the mid-term picture because it sits right at a point where structure previously broke downward.
LINK Token Technical Structure Points Toward Emerging Strength
The larger trendlines draw a wider picture of how Chainlink token behavior has unfolded across multiple months. A rising channel held the structure earlier, yet heavy selling cracked it open. This breakdown triggered the move toward the current stabilization zone.
Cihan Türkmen emphasizes that downside pressure would re-emerge below $13. The chart supports that view, since the level aligns with several liquidity points that previously fueled strong moves. A close beneath it would expose the lower support near $10.34, marked clearly by old swing reactions.
Still, price currently trades near $14, and the reaction around the trendline intersection becomes critical. Momentum indicators lean toward recovery, and the recent bounce shows buyers stepping up more aggressively than they did during the deeper part of the correction.
LINK Price and the Renewed $23 Conversation
A key question sits at the center of this analysis: does Chainlink have enough stability here to re-open the path toward $23? Cihan frames that move as possible if market momentum does not collapse. The chart illustrates why that number sits in focus. A cluster of supply zones between $18 and $23 marks an area that previously acted as a major turning point. Every time price approached the region, reactions were violent.
Read Also: “Reliable” Bitcoin Indicator Shows BTC Price Top Isn’t Here Yet: $180k Now in View
Chainlink would need consistent closes above $14.80, followed by a push through the mid-range near $18, before $23 returns fully into play. None of these steps require unrealistic conditions; they simply depend on steady market sentiment and the continued reset of indicators that have started shifting upward.
For now LINK remains in a stabilizing phase. Turbulence has cooled and price action is no longer sliding with the same intensity seen earlier. As Cihan Türkmen explains, Chainlink is regaining footing, and the next decisive move will shape the mid-term outlook. Whether the market grants enough strength for a move toward $23 depends on how price behaves around the current compression zone.
Subscribe to our YouTube channel for daily crypto updates, market insights, and expert analysis.