

Chainlink (LINK) has been trending lower for most of the past year. Interest faded, price cooled, and many traders moved on. Now, the weekly chart is starting to show something different.
LINK is not breaking out yet. There is no strong pump or sudden momentum. Now, a small shift is starting to show on the chart. This kind of signal usually appears near key turning points.
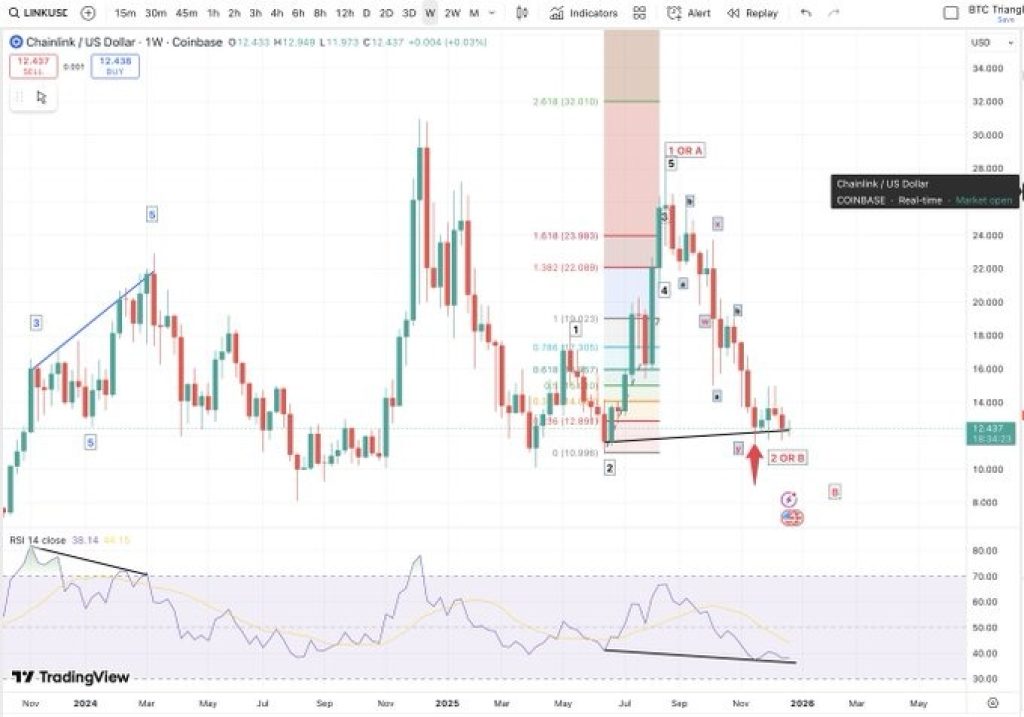
Since its last peak, LINK has kept making lower highs and lower lows on the weekly chart. That move pulled price back to levels seen before the 2024 run.
Selling pressure has eased compared to earlier in the year, and the recent drops have been smaller and slower.
Lately, the sell-offs have slowed. Price is no longer dropping fast, but buyers are not stepping in yet either. That balance is where early signals tend to form.
What you'll learn 👉
Here’s What LINK Chart Is Showing
Veteran trader Matthew Dixon shared on X that LINK is now showing a hidden bullish divergence on the weekly timeframe. This happens when price makes a higher low while momentum indicators, like RSI, make a lower low.
In simple terms, the Chainlink price is holding up better than momentum suggests. That usually means selling strength is weakening, even if price still looks heavy.
Dixon points out that the last major divergence on the LINK price was bearish and correctly warned of the drop. This time, the signal is pointing the other way.
Hidden bullish divergence does not mean price will rally right away. It suggests that the downside risk is shrinking and that higher prices become more likely over time if support holds.
What the indicators are saying
On the weekly RSI, momentum remains low but is no longer collapsing. Each sell-off is pushing the indicator less than before. That loss of downside momentum is the key part of this setup.
The Chainlink price is also sitting near long-term support zones that have mattered in past cycles. Volume has cooled, which fits with the idea that forced selling has mostly passed.
None of this confirms a trend reversal yet. It does suggest that LINK is moving out of a weak phase and into a zone where accumulation often starts.
Read Also: Here’s Where Ripple’s XRP Price May Be Headed This Week
What to watch next For Chainlink
For this setup to stay valid, LINK needs to hold recent lows. A clean break below them would weaken the bullish case. On the upside, reclaiming prior resistance zones would be the first sign that buyers are stepping back in.
For now, the LINK price remains in a recovery phase, not a breakout phase. The signal forming on the weekly chart does not promise fast gains, but it does hint that the worst part of the decline may already be behind it.
This is the kind of setup that tends to go unnoticed until price starts moving. By the time it becomes obvious, the quiet phase is usually over.
Subscribe to our YouTube channel for daily crypto updates, market insights, and expert analysis.


