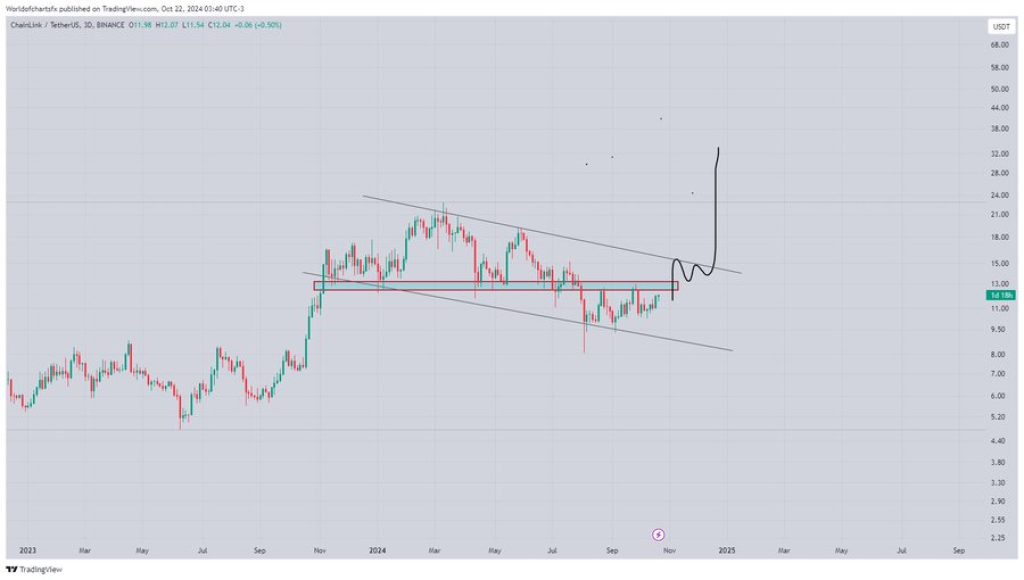
Recent chart analysis from World of Charts reveals that Chainlink (LINK/USDT) is exhibiting signs of strength following an extended correction period. The analysis highlights several key elements that suggest potential upward movement.
The chart posted by the analyst features a potential bullish flag pattern, which is commonly associated with the continuation of an upward trend after a consolidation phase.
This pattern is defined by a sharp upward movement, referred to as the flagpole, followed by a descending channel that resembles a flag. A breakout above this channel could indicate the resumption of the previous uptrend.
Read Also: Solana Looking ‘Hot Right Now’: Chart Shows SOL Price Path to This Target Zone
Doge2014 raises 500K in days celebrating Dogecoin. Make potentially big profits and get in on exclusive airdrop!
Show more +Chainlink (LINK) is currently testing a significant horizontal resistance level, notably in the $14-$15 range. This level has been tested multiple times in the past, and a successful break above it would serve as a crucial bullish signal.
As the analyst stated:
“#Link Finally Chainlink Looking Strong After Long Correction Forming Bullish Flag While Testing Crucial Horizontal Resistance Incase Of Breakout Link Can Target Trendline Resistance 15$ In Coming Days And If Trendline Got Cleared Too Then Can Hit 30$ Easily In Coming Weeks”
What you'll learn 👉
LINK Price Targets
First Target ($15): If LINK manages to breach this horizontal resistance, the immediate target would be the upper trendline of the descending channel, around $15.
Second Target ($30): Should LINK break this trendline resistance, the chart suggests a substantial upward movement toward $30. This projection aligns with a classic bullish breakout from a flag pattern, where the price target is often based on the height of the flagpole.
The downward trendline, which has constrained price action during the correction phase, remains a pivotal area to monitor. A successful move above this trendline would indicate a shift in market sentiment from bearish to bullish. If LINK can clear this resistance, analysts foresee a sharp rally, potentially doubling its price in the coming weeks.
Read Also: Solana Looking ‘Hot Right Now’: Chart Shows SOL Price Path to This Target Zone
Key Levels to Watch
Support: A critical support level is identified around $12-$13. A drop below this range could undermine the bullish setup.
Resistance: The immediate resistance to monitor is the $15 level. A sustained move above this point, particularly with high trading volume, would confirm the bullish breakout. Beyond that, further resistance exists around the $30 mark, as indicated on the chart.
Subscribe to our YouTube channel for daily crypto updates, market insights, and expert analysis.
We recommend eToro
Wide range of assets: cryptocurrencies alongside other investment products such as stocks and ETFs.
Copy trading: allows users to copy the trades of leading traders, for free.
User-friendly: eToro’s web-based platform and mobile app are user-friendly and easy to navigate.


