

Chainlink has been gaining attention from big institutions. According to CryptoED, major global players like Visa, Fidelity, ANZ, Accenture, and even King’s College London have mentioned Chainlink in their research and reports. These companies are highlighting LINK’s role in powering the infrastructure behind the tokenization of real-world assets.
With tools like CCIP for cross-chain communication and verifiable compliance, Chainlink seems to be sitting right at the center of this new digital shift.
But while the fundamentals look promising, the LINK price tells a very different story.
What you'll learn 👉
LINK Price Breaks Lower in a Bearish Channel
Chainlink is now moving inside a descending broadening channel. This kind of pattern usually appears when volatility increases in a downward trend. What makes things worse is that every time the price tries to bounce back, it loses steam more quickly. Sellers are stepping in faster with each failed rally.
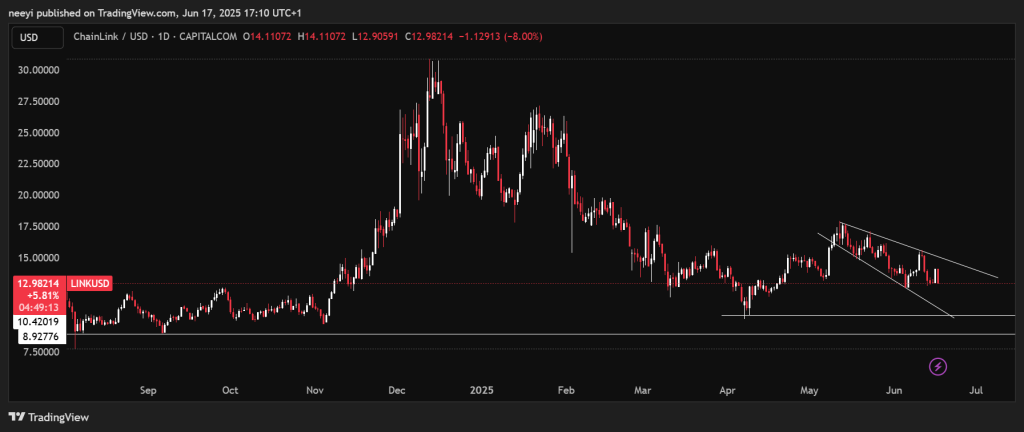
The most recent daily candle shows a sharp drop of 7.85%, right from the upper end of the channel. That’s a clear rejection and a signal that sellers are still very much in control.
Weak RSI and MACD Keep Chainlink Price in Bearish Zone
The RSI, or Relative Strength Index, is sitting below 50, hovering around 41.97. That matters because the 50 mark is often seen as the dividing line between bullish and bearish momentum. LINK has been struggling to get above it. The market just isn’t showing much buying pressure, and that makes it hard for the price to mount any kind of real recovery.
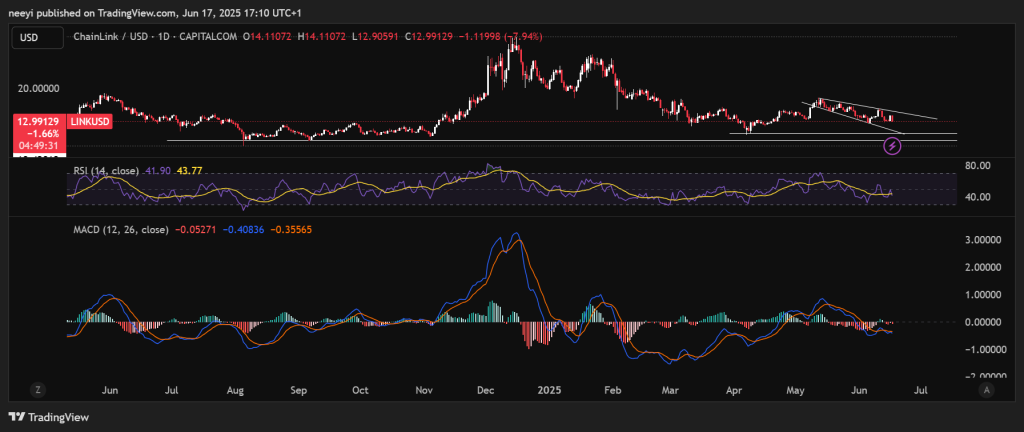
Looking at the MACD, there is no sign of a turnaround either. Both MACD lines are well below the zero mark. They are pointing down, and the histogram is slightly negative and fading. There is no bullish crossover in sight. All of this supports the idea that LINK could continue trending lower in the near term. Buyers are clearly not stepping in with enough force to change the momentum yet.
Key Support Levels Might Not Hold
Right now, the Chainlink price is hovering just above a group of support levels. These are areas where the price has bounced in the past, but they are getting tested again. If LINK breaks through this support zone, the next likely stop is between $11.50 and $10.80. And if it slips below that range, it might fall all the way toward the psychological $10 mark or even lower.
Read Also: XRP to $20? Here’s How the Next Big Move Could Happen
Despite the growing institutional interest in Chainlink and its expanding role in tokenized assets and decentralized finance, the technical chart does not reflect that optimism just yet. LINK is stuck in a bearish pattern, and all key indicators are still flashing warning signs. Unless the bulls step in strongly and push the price above the upper edge of the channel, the bias remains clearly to the downside.
So for now, the message from the chart is simple. Institutional involvement may be rising, but until that translates into actual market demand and stronger price action, LINK remains vulnerable to more losses.
Subscribe to our YouTube channel for daily crypto updates, market insights, and expert analysis.


