
Celestia price just lit up the charts with a technical signal that has traders paying close attention. According to analyst Ali, the TD Sequential indicator has printed a buy signal on the weekly chart, hinting that the token could be gearing up for a rebound after weeks of heavy selling pressure.
What you'll learn 👉
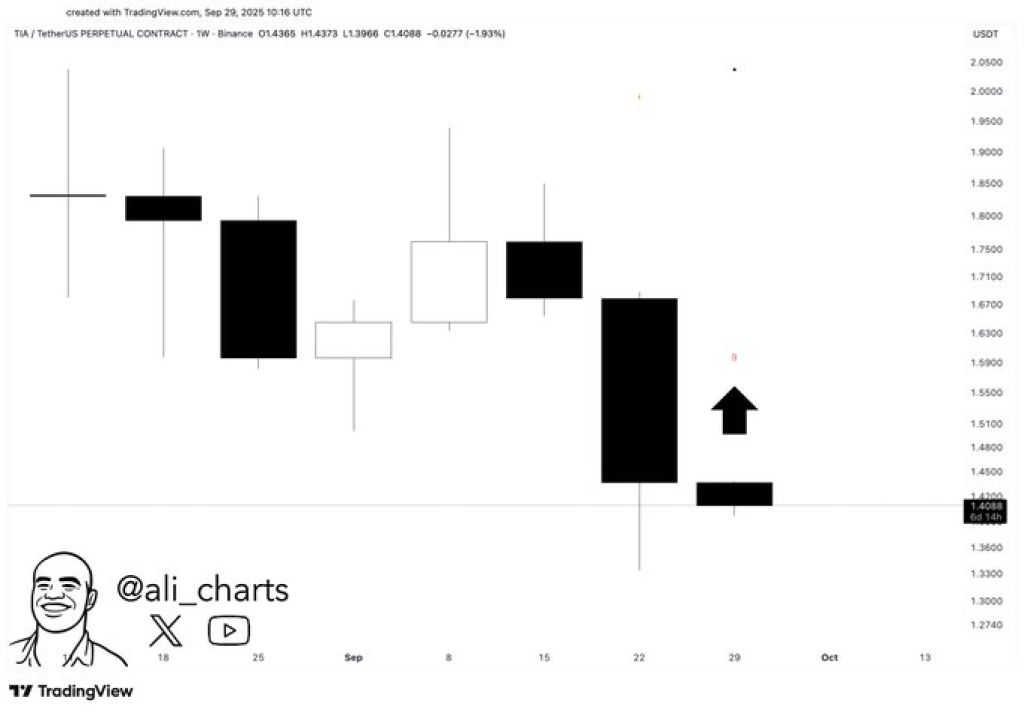
What the TIA Chart Is Showing
Looking at the weekly candles, TIA price has clearly struggled over the past month. The token has been trending downward from highs above $1.90 and recently touched lows near $1.36.
That long wick shows that buyers did step in around those levels, trying to defend against further downside. Now, the TD Sequential has flagged a potential turning point, suggesting the selling momentum might be cooling off.
The placement of this signal is what makes it interesting. It arrives after a strong series of red candles, which is typically when the indicator is most reliable. If buyers build on this, we could see TIA attempt to reclaim the $1.55–$1.60 range before pushing higher.
Read Also: Ripple vs. SWIFT? XRP Community Weighs in as ConsenSys Enters the Picture
Why the Signal Matters
The TD Sequential is a popular tool among traders because it often highlights exhaustion in trends. In TIA’s case, the indicator is suggesting that sellers may have run out of steam on the weekly timeframe.
That does not necessarily signal a sudden reversal, but it does set the stage for a bounce, especially if volume starts to increase.
It is also interesting that this indicator is coming at a time when general altcoin sentiment is poor. If the market can hold up, TIA price could benefit disproportionately as investors look for tokens that are showing early momentum.
Read Also: VeChain Price Prediction: How Much Could $500 in VET Be in 2026?
TIA Price Short-Term Outlook
For now, the immediate support to watch sits around $1.36. As long as that level holds, the buy signal remains valid and could push prices higher.
The first real test for the bulls will be breaking above $1.55, which has acted as resistance in recent weeks. A clean move past that level could open the door to $1.70 and beyond.
On the flip side, failure to hold support would weaken the signal and could drag TIA price back toward the $1.25 zone. That’s why the next few candles will be critical. If momentum builds, the buy signal spotted by Ali could mark the beginning of TIA’s next recovery leg.
Read Also: Here’s How Chainlink (LINK) Price Could See Its Next 2x Spike
Subscribe to our YouTube channel for daily crypto updates, market insights, and expert analysis.