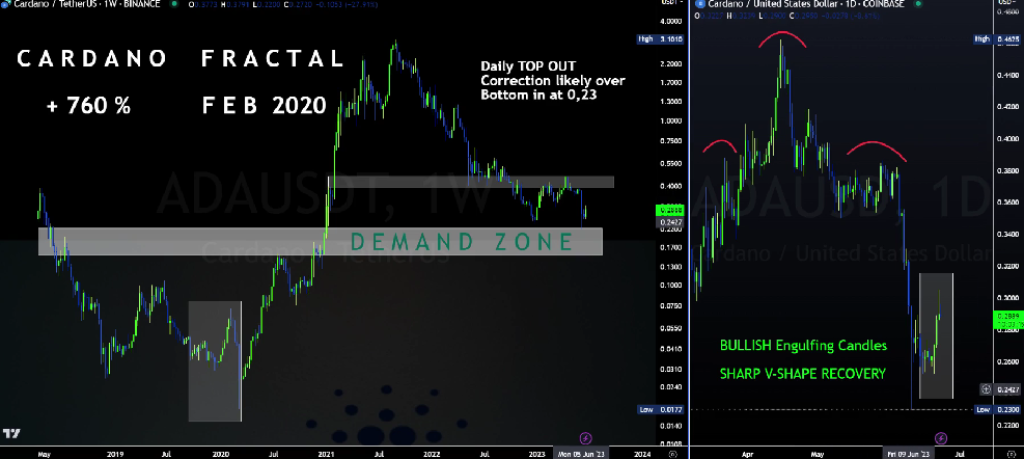
In the world of cryptocurrency, technical analysis is a vital tool for traders and investors. Today, let’s dive into the recent developments in Cardano’s price action against Tether (ADA/USDT). After a prolonged bearish trend, ADAUSDT seems to have bottomed out at approximately 23 cents. This development concludes the bearish Head and Shoulders pattern observed in the daily charts.
What’s particularly intriguing is the formation of a bullish engulfing candlestick in the weekly timeframe. For those unacquainted with the term, a bullish engulfing pattern is a candlestick pattern that occurs at the end of a downtrend and signals a potential reversal. This pattern is highly regarded among traders and is often considered a strong buy signal.
Doge2014 raises 500K in days celebrating Dogecoin. Make potentially big profits and get in on exclusive airdrop!
Show more +Now, let’s take a trip down memory lane. Back in February 2020, a similar pattern was observed, which was followed by a strong V-shaped recovery. This marked the beginning of a significant bull run for Cardano. Could history be repeating itself? It’s a possibility that cannot be ignored.

Source: TradingView
Moreover, it’s essential to consider the fundamental aspects. Cardano recently underwent the Hydra update. Could this be the catalyst driving the bullish price action? The markets are known for reacting to fundamental changes, and this update could be playing a role in the current developments.
As an analyst, it’s crucial to approach the markets with an open mind and consider all possibilities. While the technical indicators are leaning towards a bullish scenario, it’s always wise to exercise caution and employ risk management strategies. The cryptocurrency market is highly volatile, and while the rewards can be substantial, so can the risks.
Cardano’s recent price action presents an interesting opportunity for traders and investors. With the bullish engulfing pattern and the historical precedent, there is a case to be made for a potential upswing. However, as always, it’s imperative to trade responsibly and stay informed.
Polkadot’s Resilience: A Strong Bounce from Key Support Level
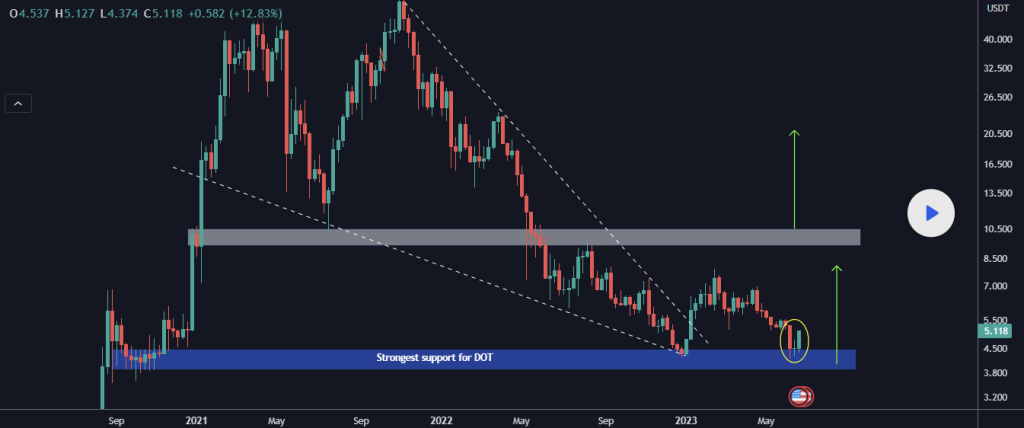
Polkadot (DOT) against Tether (USDT) has recently shown a promising sign of resilience. After a period of downward pressure, DOT has started to bounce back robustly from the $4 region. This area has proven to be the strongest support for Polkadot, a testament to the cryptocurrency’s robustness amidst market volatility.
What’s particularly noteworthy is the potential for the commencement of bullish waves from this point. This could signal the start of a new upward trend for Polkadot, a development that traders and investors should keep a keen eye on.

Source: TradingView
The current weekly green candle is another point of interest. If this candle ends by fully engulfing the previous large red one, it would serve as a confirmation of the bullish trend. This engulfing pattern, if it materializes, could be a strong buy signal for market participants.
However, for the bullish trend to sustain, it’s crucial that the blue zone support holds. This support level is a critical line in the sand that could determine the future price direction of Polkadot.
Polkadot’s recent price action paints a picture of resilience and potential bullish momentum. The bounce from the key support level and the potential for a bullish engulfing pattern provide a compelling case for a possible upswing. However, as always, it’s crucial to trade responsibly, monitor market developments closely, and employ sound risk management strategies.
Stay tuned for more in-depth analyses and insights into the fascinating world of cryptocurrencies.


