Cardano (ADA) Price on the Verge of a Breakout, Will MATIC $0.50 Support Level Hold or Crumble?

One digital asset that has been garnering significant attention is Cardano (ADA). The ADA token has been performing in line with market expectations, closely following its projected wave count. This article aims to provide an in-depth analysis of ADA’s price movements and future predictions.
Cardano’s price trajectory suggests that it peaked during its fourth wave on April 15th and is currently in its fifth wave. There are two potential scenarios to consider. The first is a 1-2-1-2 setup, which would necessitate two more lows. The second scenario is an ending diagonal, with the wave one situated at the low of May 10th or 11th. This would mean that waves one, two, and three are already complete, and the token just needs one more low to complete the cycle.
At this stage, it’s challenging to definitively say whether we’re dealing with an impulse or an ending diagonal. The key is to observe the next low—if it occurs—and determine whether it’s followed by an impulsive reaction. Currently, ADA is consolidating sideways.
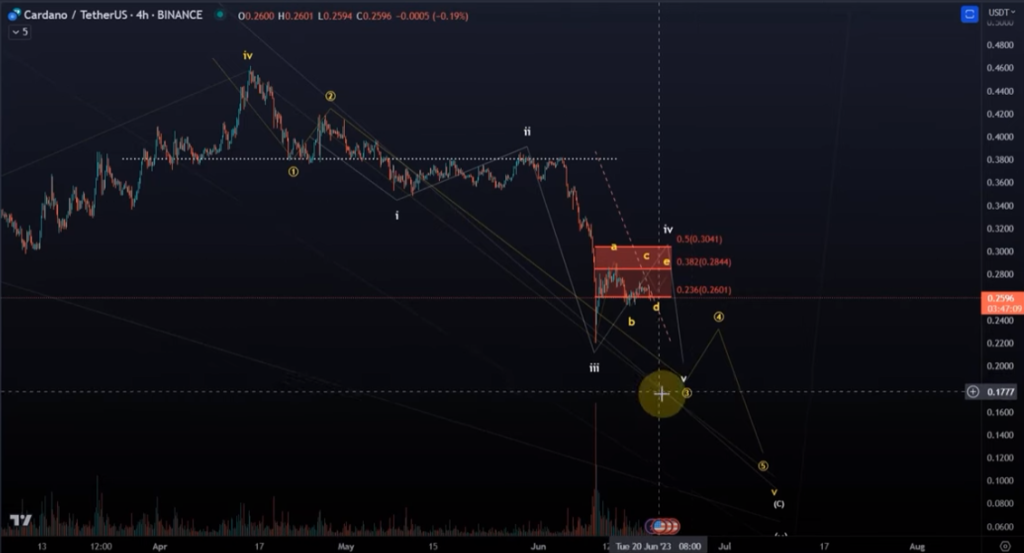
Source: TradingView
A closer look at ADA’s price movements reveals the possibility of an Elliott wave triangle forming. The A wave might have peaked on June 13th, the B wave low on June 15th, the C wave peak on June 17th, and the D wave could be forming now. This would be followed by one more high in an E wave. However, it’s crucial that this forms a lower high. If it forms a higher high, the triangle could extend as long as the price doesn’t exceed 29 cents.
If the price does go above 29 cents, then 30.4 cents will act as resistance, and ADA could form a larger ABC or WXY structure in wave 4. The bottom line is that a lower price is expected as long as the price cannot break and sustain above 30.4 cents.
If the price breaks below the B wave low at 25.3 cents, there’s a good chance that wave 5 has already started. However, the move down was only in three waves, and this move up was in three waves as well, so it’s not crystal clear that it’s heading down in an impulse. This wave 5 could also be an ending diagonal.
Looking at resistance levels, if ADA breaks 30.4 cents, there’s minor resistance at 33 cents and 35.5 cents, with a significant resistance level at 38.5 cents. This level acted as a strong support and resistance point in late April and throughout May. Breaking above this level would have bullish implications. Until then, bullish probabilities for a bullish outcome would increase above 30.4 cents, but a breakout of 38.5 cents would provide more confidence in a turnaround.
In conclusion, the crypto market, especially lower time frames, can be volatile and challenging to predict. However, by keeping a close eye on these key levels and wave counts, investors can gain a clearer understanding of ADA’s price movements and make informed decisions. As always, it’s crucial to remember that these are personal opinions and should not be considered financial advice.
Matic: A Dark Horse in the Crypto Race
In the tumultuous world of cryptocurrency, Matic has recently demonstrated its resilience by testing the $0.50 support level, a significant milestone, and bouncing back impressively. This is a clear indication that we are currently in oversold territory. As anticipated, Blackrock ETFs have strategically lowered prices to secure the most advantageous entry point for the corporate giant.
Matic is not to be underestimated. Often referred to as the ‘dark horse’ in this race, it presents a potential opportunity that investors should not overlook. The $0.50 mark is a historical level and we anticipate a fierce battle at this point between support and resistance. The outcome of this struggle will largely depend on the closing of the upcoming weekly candle.
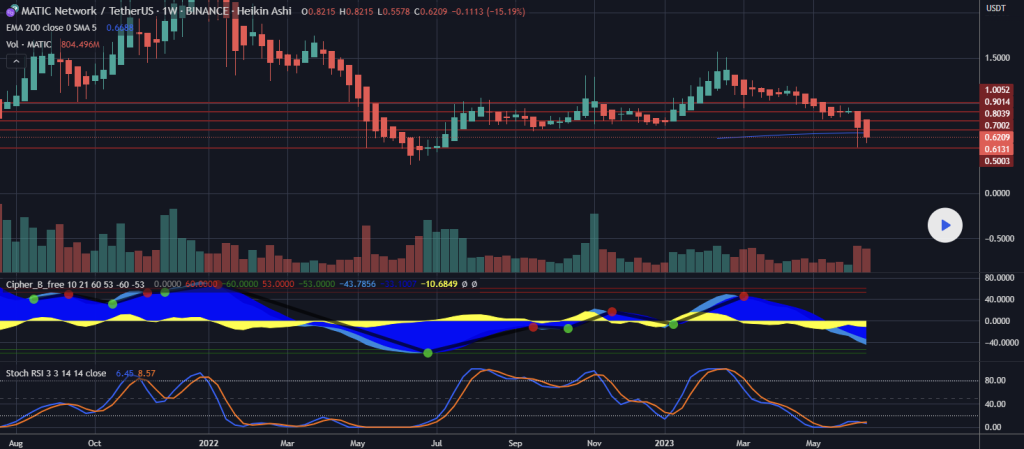
Source: TradingView
The direction we move towards our goal will become apparent once this candle closes. If we see a positive close, it will indicate a bullish trend, while a negative close could signal a bearish trend.
The levels at which we expect to sell are as follows:
- $1.00 (Sell #1)
- $1.64-$1.75 (Sell #2)
For these targets to be achieved, we need to see five more days of consistent buying volume. This will allow us to consolidate into support and close the weekly candle, which ends in five days, ABOVE the 200 MA. It is crucial that we stay above the $0.669 level by the weekly close. If we fail to do so, we risk falling further down.
Holding this level is paramount. If we manage to do so, we should witness 5-7 weeks of higher highs, which would lead us to our selling price around sometime in August 2023.
However, if this does not materialize, we expect Matic to fall further into the $0.35-$0.45 range. There is a 5-10% chance of this happening.
Regardless of these potential fluctuations, we anticipate Matic to reach a minimum of $1.50 by the end of the year before the next major pullback in November/December or the start of 2024. This projection is based on current market trends and historical data, but as always in the world of cryptocurrency, investors should proceed with caution.