
Cardano token has lost around 20% of its value in less than two weeks. Looking at the chart right now, ADA price shows a pattern that suggests this dip might not be the end of the road.
Since the beginning of July, each time Cardano token dipped, it found support around the upward trend line, bouncing back to form higher highs and higher lows. Right now, the ADA price is once again close to testing that line. If history repeats itself, it could soon bounce back strongly and move above $1.
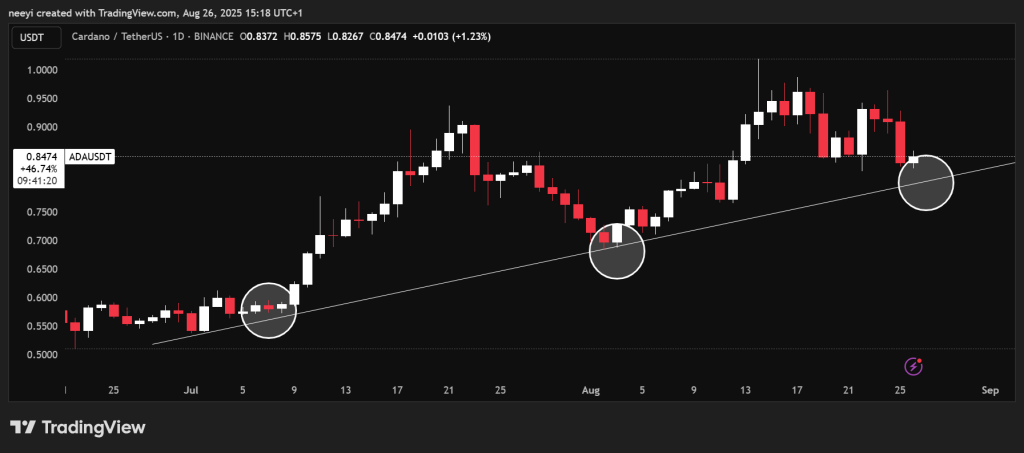
The first touch happened in early July near $0.56, the second in early August near $0.66, and the third is the current test around $0.84, though it has not yet touched the trend line. The price climbed from the July low to a high around $1 before the 20% drop over the last two weeks.
The candles show a pattern of higher highs and higher lows, and if this support holds again, the pattern suggests a bounce that could push ADA back above $1.
Weekly Indicator Readings Point to Long-Term Strength While the Short-Term Looks Mixed
We checked the weekly indicator readings on Investing.com to see how the bigger picture looks. The weekly readings are bullish, supporting the idea that the longer-term trend remains intact.
Hourly indicators present a different tone, showing the possibility of a short-term dip before any sustained upward movement. This means short-term traders should expect volatility, but longer-term holders have reasons to remain optimistic. Below is a summary of the readings on the weekly outlook.
| Name | Value | Explanation |
| RSI (14) | 54.984 | Neutral zone, showing that ADA is not overbought or oversold. |
| STOCH (9,6) | 63.006 | Buy signal, showing momentum is leaning upward. |
| MACD (12,26) | 0.037 | Buy signal, showing the trend is still supportive for growth. |
| ADX (14) | 28.357 | Buy signal, showing the strength of the trend, is healthy. |
| ATR (14) | 0.1432 | Less volatility, showing price swings are not too extreme right now. |
| Bull/Bear Power | 0.2381 | Buy signal, showing bulls still have the edge over bears. |
The chart shows ADA pulling back to a trend line that has held during prior tests. The weekly indicators support the idea that the larger trend is bullish.
The hourly indicators suggest a chance of a short-term drop before a clearer move upward. Taken together, the technicals indicate that this could be a normal pullback within an ongoing uptrend rather than a full trend reversal.
Read Also: Aave (AAVE) Price Could Finally Break Its Downtrend – Here’s How It Could Turn Out
Traders who want to buy can watch for the price to hold the trend line and show a clean bounce. Long-term holders can find comfort in the weekly signals and the higher highs and higher lows structure that remains in place.
Subscribe to our YouTube channel for daily crypto updates, market insights, and expert analysis.