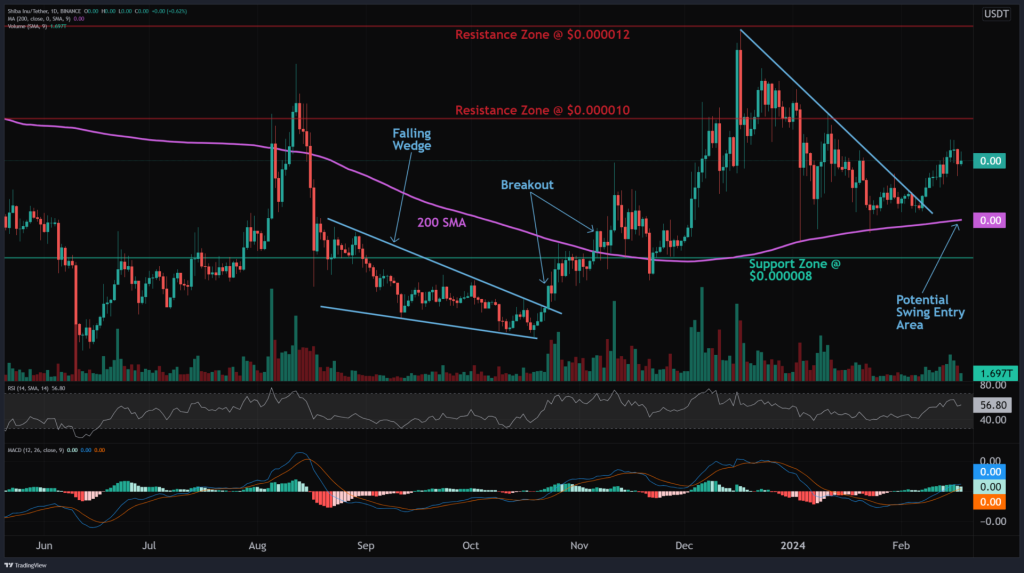
Shiba Inu’s price has seen modest gains of 2% today to trade around $0.0000097, after briefly breaking above resistance at $0.00001 on Friday before getting rejected. The meme coin has faced difficulty clearing the $0.00001 level in early 2024, a key area that analysts are watching closely.
According to research firm altFINS, “Price has resumed its uptrend and is approaching $0.000010 resistance. Now we wait for a break above that resistance or a pullback to 200-day moving average for another swing trade entry opportunity.” They have set a price alert at this level.
Analyzing the key indicators, altFINS describes the SHIB trend as bullish across short, medium and long-term timeframes. However, momentum may be peaking – “MACD Line is above MACD Signal Line and RSI is above 55 but momentum may have weakened since MACD Histogram bars are declining.” This suggests bullish momentum is present but could be fading.

Source: altFINS – Start using it today
The MACD Line and MACD Signal Line are used in the MACD (Moving Average Convergence Divergence) technical indicator. The MACD Line is the difference between two moving averages, while the Signal Line is an exponential moving average of the MACD Line itself.
When the MACD Line crosses above the Signal Line, it is considered a bullish crossover – indicating strengthening upside momentum in the price. At the moment, SHIB’s MACD Line remains above the Signal Line, signaling ongoing bullish momentum.
However, the MACD Histogram represents the difference between those two lines. Declining bars on the Histogram suggest bullish momentum may be weakening despite the Line remaining above the Signal.
The RSI (Relative Strength Index) indicator measures the speed and rate of an asset’s price changes to determine overbought or oversold conditions. An RSI above 50 typically signals bullish momentum, while below 50 is bearish. Specifically, an RSI above 55 indicates strong upside momentum, but under 70 is not yet considered overbought.
Doge2014 raises 500K in days celebrating Dogecoin. Make potentially big profits and get in on exclusive airdrop!
Show more +SHIB’s current RSI above 55 underscores the bullish view. However, as with the MACD, the indicator may be showing early signs of peaking momentum as buyers lose conviction. This lines up with the view that while SHIB’s core trend remains bullish, upside momentum could be fading as it faces the major $0.00001 resistance barrier.
Determining whether bulls can renew momentum or a pullback ensues depends on if SHIB can break above $0.00001 decisively in the near-term.
For support and resistance, altFINS sees the nearest support at $0.000008, followed by resistance at $0.000010 which aligns with previous 2023 highs. Above that sits resistance at $0.000012.
Notably, Watcher Guru reported a 40% increase in activity on the Shibarium layer-2 network on Friday, which is fueling the latest SHIB price rally. Specifically, new BONE transfers rose from 33,775 to 47,714 in a single day. This follows unprecedented growth last Wednesday, when transfers surged from 415 to over 33,000.
As Watcher Guru notes, growing activity on platforms like Shibarium is contributing to SHIB’s ability to “delete another zero” in its price – referring to breaking the crucial $0.00001 resistance area. Continued development of supporting ecosystem networks may strengthen the chances of SHIB breaking this barrier.
You may also be interested in:
- Has Bitcoin’s 4-Year Cycle Been Broken? A Closer Look Says No as BTC Price Faces Crucial Test
- Why Is SUN Coin Price Pumping?
- BONK Outperforming Shiba Inu (SHIB) as New Memecoin Rebel Satoshi ($RBLZ) Starts To Gain Investor’s Attention
We recommend eToro
Wide range of assets: cryptocurrencies alongside other investment products such as stocks and ETFs.
Copy trading: allows users to copy the trades of leading traders, for free.
User-friendly: eToro’s web-based platform and mobile app are user-friendly and easy to navigate.


