
Mantra (OM) has drawn attention after forming a bullish technical pattern that could signal a strong upward move. Mantra is trading at $6.26 now. Some analysts think it might break out and jump 30-40% in price. People are talking about it on X, wondering if the price of OM will continue its earlier rise.
The OM chart displays a falling wedge pattern, a formation often associated with bullish reversals. Over the past few weeks, OM’s price has traded within this contracting wedge, with lower highs and lower lows. The price is now testing the upper boundary, and if a breakout occurs, analysts suggest that OM could see a 30-40% increase.
Support and resistance levels are key in this setup. The lower boundary of the wedge has acted as support, preventing further declines, while the upper trendline remains a resistance point. A confirmed breakout could turn resistance into support, reinforcing the possibility of a sustained upward move. Traders are watching for buying volume to increase and a daily close above the resistance as confirmation of a bullish breakout.
Read Also: Why Bitcoin (BTC) and the Crypto Market Are Down – Robert Kiyosaki Warns of a Historic Market Crash

What you'll learn 👉
Mantra (OM) Market Sentiment
Crypto analysts have shared insights on X regarding OM’s price movements. Top analyst World Of Charts noted that OM’s price has been in a long correction and identified the falling wedge as a key pattern. The analyst suggested that a successful breakout could increase the price by 30–40%, aligning with the chart analysis.
Another analyst, King Crypto, highlighted that the price of OM recently dipped to $5.8 before recovering above $6.3. The post mentioned that this decline allowed more investors to accumulate the token and pointed out that a continued bounce from current levels could confirm a bullish continuation.
Mantra Key Support and Resistance Levels to Watch
OM’s price has key support at $6.3, which has been tested multiple times. Holding this level is important for sustaining bullish momentum. Another key support is at $5.8, which was the lowest point of the recent dip. On the upside, resistance sits near $7.5 to $8.0, levels that could be tested if the breakout materializes.
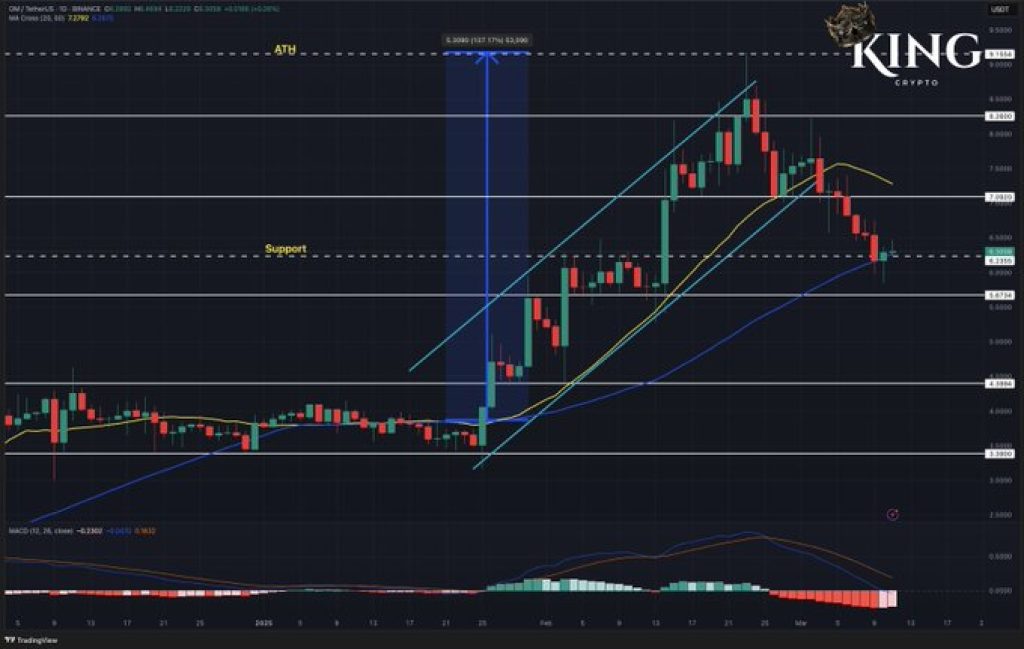
Moving averages also provide insight into potential movements. The 20-day MA was recently broken, indicating short-term weakness, while the 50-day MA is acting as a support level. If OM maintains strength above the 50-day MA, it could fuel another upward push. The MACD indicator shows weak momentum, but a bullish crossover could confirm the next move.
However, OM’s price is at a decisive point, with traders watching for signs of a breakout. Looking at the price patterns, online chatter, and technical indicators, we could see a rally if buying momentum picks up. For this to happen, the price needs to push above resistance levels with higher trading volume. This would tell us if OM can reach those predicted targets.
Subscribe to our YouTube channel for daily crypto updates, market insights, and expert analysis.

We recommend eToro
Wide range of assets: cryptocurrencies alongside other investment products such as stocks and ETFs.
Copy trading: allows users to copy the trades of leading traders, for free.
User-friendly: eToro’s web-based platform and mobile app are user-friendly and easy to navigate.