
Bitcoin and the stock market have moved together closely enough that weakness in US equities remains relevant to any BTC price prediction. That relationship becomes especially important when stocks trade near record levels and Bitcoin struggles to recover lost ground.
The connection has not been consistent throughout the year. Research presented by More Crypto Online puts Bitcoin’s correlation with the S&P 500 below 0.3 between June and September, before it climbed toward 0.6 over the latest 6 weeks covered in the analysis.
That closer relationship raises a difficult question because Bitcoin has already suffered a substantial correction. A video from the More Crypto Online crypto channel on YouTube examines whether another stock market crash would deepen that decline, and its historical comparisons reveal more about what could happen next.
What you'll learn 👉
Bitcoin Fell Harder Than Stocks During 5 Of 6 Major Declines
More Crypto Online reviewed 6 periods since 2014 when the S&P 500 fell at least 10% from a record high. Those episodes covered 2015, 2 separate declines during 2018, the COVID crash in 2020, the 2022 downturn, and spring 2025.
Bitcoin suffered a larger decline than stocks during 5 of those 6 episodes. The channel’s research puts Bitcoin’s median maximum decline around 43%, approximately twice the corresponding stock market decline.
The range matters more than that average relationship. Across the 4 episodes when stocks fell close to 20% or more, Bitcoin lost approximately 21% to 66%.
The 2025 comparison produced the mildest Bitcoin decline within that group, with stocks down about 19% and BTC down approximately 21%. The 2022 episode was much worse, although Bitcoin also faced a crypto bear market and the collapse of FTX.
Those different circumstances prevent a simple rule that a 20% stock market crash must produce a 40% Bitcoin decline. More Crypto Online’s findings establish a historical tendency, not a fixed formula.
Bitcoin’s Existing Correction Could Limit Another Decline
Bitcoin was already approximately 33% below its record high in the video’s analysis. That creates a reasonable argument that some excess has already left the market before any major stock market correction.
More Crypto Online points to 2015 as an example. Bitcoin entered that episode well below its previous peak and subsequently fell about 10%, less than the stock market decline.
However, previous damage does not guarantee protection. Bitcoin was also well below its high before the equity declines of late 2018, 2020, and 2022, and further heavy losses followed.
The recent increase in correlation therefore deserves attention. A reading near 0.6 indicates a stronger positive relationship between returns, although it does not mean Bitcoin copies every stock market move.
More Crypto Online considers a milder Bitcoin pullback plausible this time. The analyst’s preferred chart structure supports that possibility, but another equity selloff could still accelerate an existing BTC correction.
More Crypto Online’s BTC Price Outlook Centers On Support Below $75,000
The channel’s immediate outlook allows Bitcoin to rebound before another decline. The analyst describes the fall from September 21 as a corrective structure and identifies a descending wedge that supported expectations for a bounce.
The concern is whether that recovery develops into a stronger advance or remains a temporary interruption.
More Crypto Online identifies approximately $63,300 to $74,800 as the preferred support area for another decline. The 50 week simple moving average near $76,500 provides an earlier reference point.
The video also compares historical drawdowns from a Bitcoin reference price of approximately $85,500:
| Historical Comparison | Illustrative BTC Price | What The Scenario Means |
|---|---|---|
| A Decline Similar To 2025 | $67,500 | Bitcoin would fall into the analyst’s preferred support area. |
| A Decline Similar To 2020 | $43,000 | Bitcoin would break below that area during a deeper selloff. |
| A Decline Similar To 2022 | $29,000 | A severe downturn would activate the much more bearish alternative. |
These figures illustrate previous percentage declines applied to a reference price. They are conditional comparisons, not confirmed targets.
The bullish alternative requires better evidence. More Crypto Online wants a convincing 5 wave advance toward approximately $85,700 before placing greater weight on a direct recovery.
The channel also discusses distant bullish projections from $165,000 to $300,000 across its broader scenarios. Those depend on a much larger advance and are not the analyst’s preferred immediate outcome.
Bitcoin Price Consolidation Makes $80,000 And $83,000 Important
The accompanying Bitcoin price analysis shows consolidation after an early October high near $87,000. BTC has traded mainly between $80,000 and $83,000 since October 8, without a decisive resolution.
Repeated movement inside that range indicates that neither side has secured control. The direction of the eventual break matters more than another brief move within it.
A sustained break below $80,000 would weaken the range and expose approximately $77,000. Further selling could bring $74,000 into view, close to the upper boundary of More Crypto Online’s broader support area.
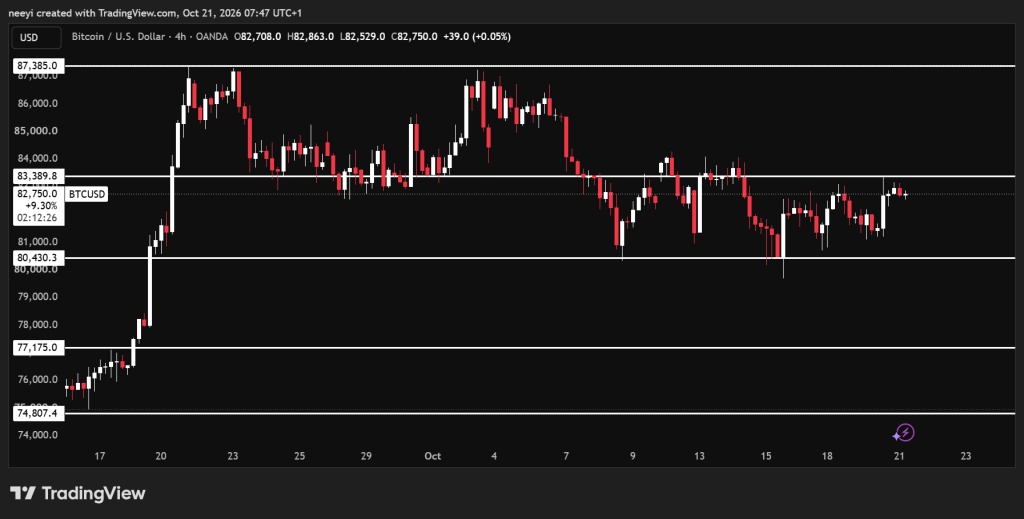
A deeper stock market decline could increase the risk of Bitcoin returning to the $60,000 region. That outcome would require further support failures beyond the initial range breakdown.
The upside sequence is clearer if Bitcoin reclaims $83,000 and holds above it. That would reopen a test of $87,000, where earlier advances met resistance.
A convincing break above $87,000 could then open a path toward $98,000. Stronger participation and sustained follow through would be necessary because a brief breakout could still fail.
Investing.com Daily Indicators Show Modest Buying Pressure Without Confirmation
The supplied Investing.com daily chart readings describe a market with some positive pressure but limited directional conviction.
| Indicator | Value | What The Reading Means |
|---|---|---|
| RSI (14) | 51.213 | Momentum is close to balanced, with only a slight bullish advantage above 50. |
| Ultimate Oscillator | 57.070 | Buying pressure has a modest advantage across the indicator’s combined periods. |
| ROC | −0.959 | Price remains slightly below its comparison period, so the recovery lacks confirmation here. |
| Bull/Bear Power (13) | 687.4831 | The positive reading supports buying pressure, although it cannot confirm a breakout alone. |
The mixed readings fit Bitcoin’s consolidation. Positive oscillator readings provide some support for recovery, but the negative ROC shows that recent price performance remains uneven.
The practical distinction is between positive pressure inside a range and an actual escape from that range.
More Crypto Online’s research also contains a recovery argument. Bitcoin traded higher 6 months after the stock market low in 5 of the 6 episodes, with a median return near 58%.
The S&P 500’s corresponding median recovery was approximately 22%. However, those results are measured from lows identified afterward, which makes them difficult to replicate in real time.
FAQs
Subscribe to our YouTube channel for daily crypto updates, market insights, and expert analysis.