
BNB is back on the radar, and this time it is not about a short-term pump or a quick trade. It’s a bigger picture.
On the two-week BNB chart, Patel argues that what we are seeing right now is accumulation rather than exhaustion. In his view, this is the kind of phase that usually goes unnoticed by retail, while larger players quietly build their positions.
However, the BNB price still maintains the upward structure that has been in place since 2023. The price has made several strong movements, even though it has pulled back. It still maintains the upward structure, following an upward trendline. It is arguably the best indicator that the BNB price is still in an upward trend, even though the momentum may be slowing.
What you'll learn 👉
Why This Area Is Key For The BNB Price Structure
The area in Patel’s chart that is perhaps most significant is the range from approximately $530-$630, as it aligns almost perfectly with the 0.382 Fibonacci retracement levels from the larger move up, at least in terms of a Fibonacci retracement analysis. This appears to be a classic long-term accumulation range.
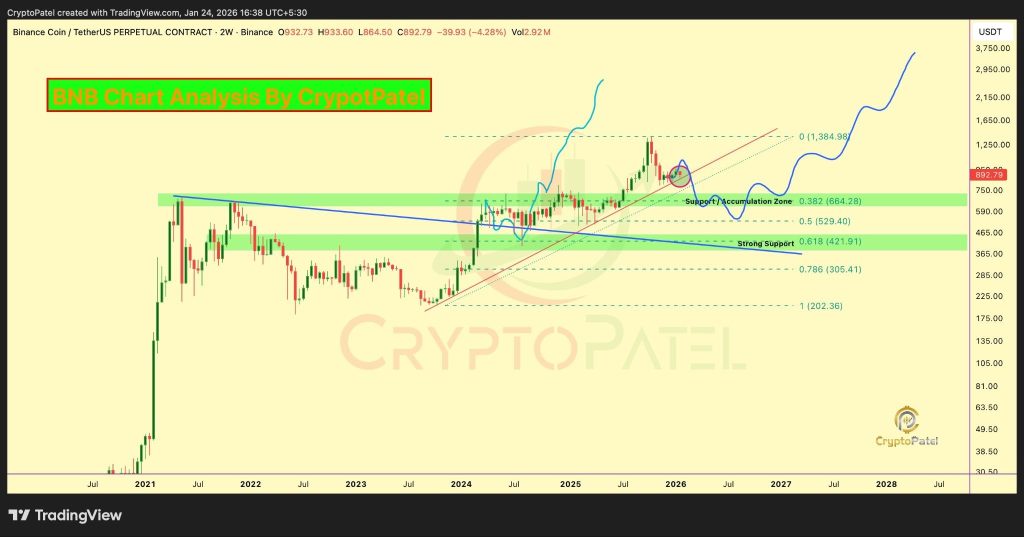
What makes this region even more interesting is how price has behaved around it. Every time the BNB price has dipped into this range in past months, buyers have stepped in. That has kept the structure clean and allowed higher lows to form, which is exactly what you would expect to see if smart money is gradually accumulating.
As long as the BNB price continues to hold this area, the broader bullish structure stays intact. If it were to break cleanly below it, that would be a different story and would likely force traders to rethink the trend.
The Importance of Higher Lows For BNB
Another point Patel highlights is the sequence of higher lows visible across the multi-year chart. Even during long consolidations and pullbacks, the BNB price has avoided printing a lower structural low since the 2023 bottom.
That detail matters. This is a sign that the higher lows are coming as a result of buyers coming in earlier and earlier with each successive correction. As a result, the current sideways action is not necessarily a sign of weakness but rather a sign of preparation.
Based on the long-term structure and Fibonacci extensions, Patel outlines several upside levels to watch. His first major target sits near $1,384, followed by $2,150, and then a more aggressive zone around $3,750 if the full extension plays out.
Whether those levels are reached in one run or over several phases is still unknown. What stands out is that these targets come from visible chart logic rather than short-term hype.
Read Also: XRP Price Prediction: How Much Could XRP Be Worth by 2030?
BNB price outlook
Right now, the BNB price is sitting in the kind of area where long-term participants usually start paying attention, while short-term traders often lose interest because nothing dramatic is happening.
Historically, that contrast has been where the biggest trends begin. As long as the ascending trendline and the $530–$630 accumulation zone continue to hold, the chart keeps pointing toward a potential expansion phase rather than a breakdown.
For now, the structure supports Patel’s view that this is often what major moves look like before they actually happen.
Subscribe to our YouTube channel for daily crypto updates, market insights, and expert analysis.