
The $6,000 Bitcoin pump that happened in 15 minutes looked like a breakout. It looked like momentum. It looked like FOMO was finally back.
It was a trap.
Alex Mason, a crypto analyst who previously called the exact $16,000 bottom three years ago and the $126,000 top in October, posted the evidence on X. The data shows coordinated wallet activity from Binance, Coinbase, Wintermute, Grayscale, and OKX within a tight window. Large blocks moved. Market buys hit thin order books. Then the same players flipped and started selling everything.
What you'll learn 👉
The Data Doesn’t Lie
The on-chain image Mason shared tells the story. Here is exactly what happened in the hours leading up to the pump:
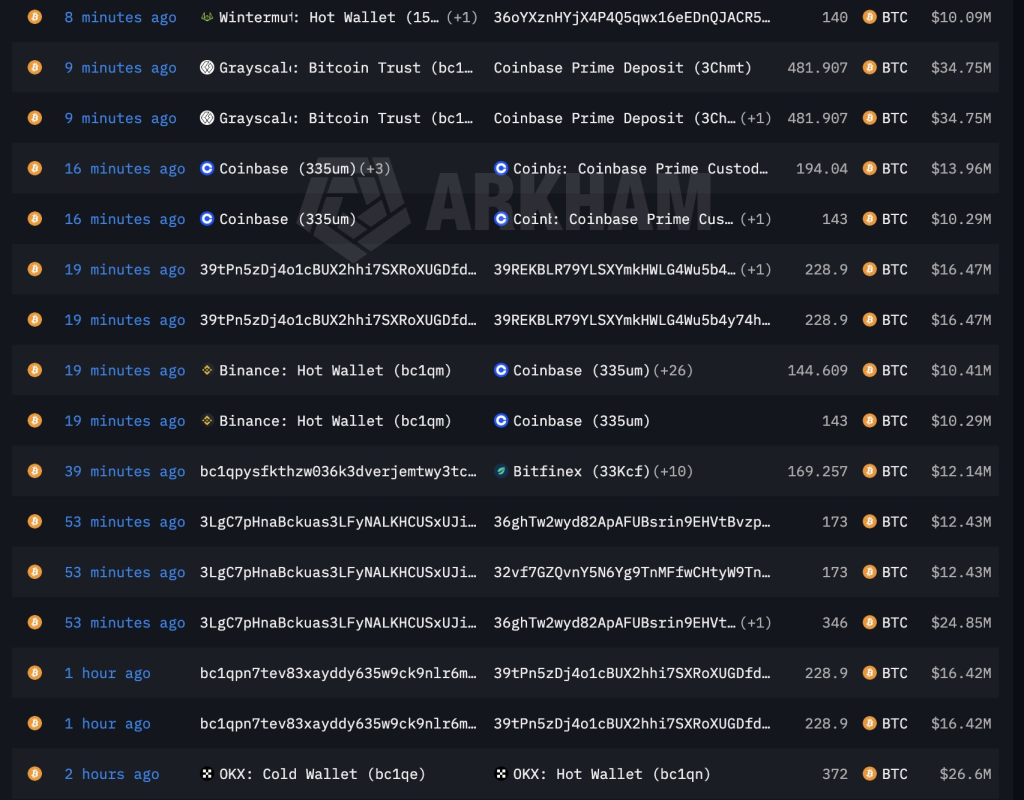
Total visible movement in this window: over 4,100 BTC valued north of $290 million.
What the Wallets Reveal
Look at the timing. Within minutes, wallets tied to Binance, Coinbase, Wintermute, Grayscale, and OKX all became active. Large blocks moved between exchanges. Grayscale alone pushed nearly 1,000 BTC into Coinbase Prime in two back‑to‑back transactions.
Wintermute (a major market maker) sent 140 BTC to an unknown address.
Binance hot wallets sent roughly 287 BTC directly to Coinbase.
Coinbase moved over 337 BTC internally to its Prime Custody wallets.
These are not random retail transactions. This is coordinated infrastructure movement.
The Manipulation Playbook
Here is what happened next, and Mason broke it down step by step:
Step 1: Thin liquidity. Order books were light. Leverage had built up on one side. Funding rates were already stretched.
Step 2: Aggressive market buys. With large wallets already positioned, someone started buying hard. Thin books meant every buy order moved price fast.
Step 3: FOMO and liquidation cascade. Price shot up $6,000 in 15 minutes. Shorts got squeezed. New longs jumped in, afraid of missing the move.
Step 4: The flip. Once enough leverage was trapped (shorts forced out, fresh longs committed) the same players started selling everything.
Step 5: Selling into liquidation zones. The data shows immediate rejection after key levels. They sold right into the liquidity created by their own pump.
Mason points out that insiders likely ran long and short positions simultaneously through separate wallets. One side profits from the pump. The other profits from the dump.
Why This Matters for Every Trader
Bitcoin does not move $6,000 in 15 minutes because of news. No headline caused this. No macro event triggered it.
Bitcoin moves like this when leverage builds up and someone with enough size decides it is time to wipe everyone out.
The coordinated inflows to exchanges (visible on the image) tell the real story. Clustered market buys in a tight window. Then immediate selling right into the move they created.
This is how insiders dump without crashing price. Push price into liquidity. Trigger liquidations. Sell into the move.
What to Watch Instead of Charts
Mason’s advice: stop staring at price candles.
Watch funding rates – stretched funding signals a trap.
Watch open interest – high OI with thin liquidity is gunpowder.
Watch where coins are moving, not where price is going. Exchange inflows from known institutional wallets precede these events every time.
The image shows the footprints. Binance to Coinbase. Grayscale to Prime. Wintermute to unknown. All inside two hours. All before the pump.
Subscribe to our YouTube channel for daily crypto updates, market insights, and expert analysis.