
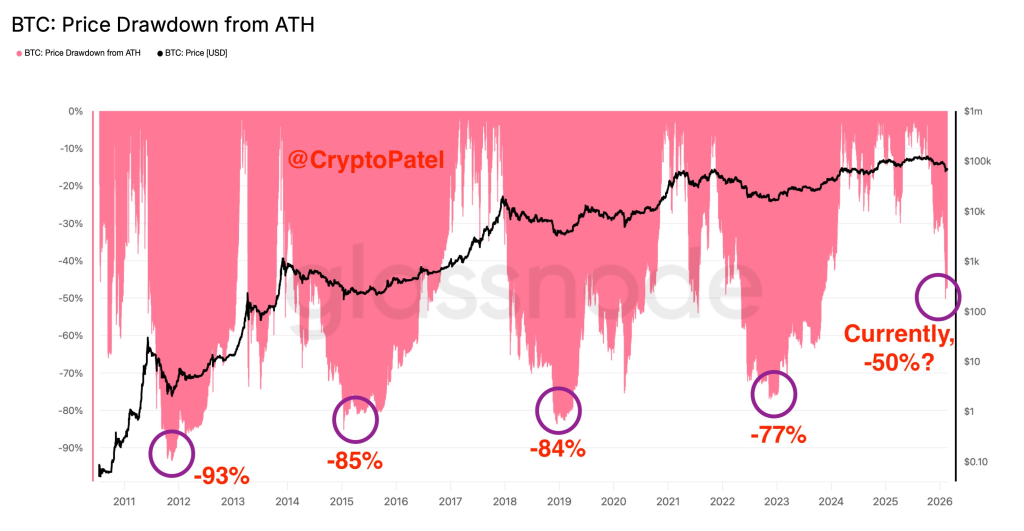
The chart shared by Crypto Patel puts Bitcoin’s current drawdown into long-term perspective by mapping every major peak-to-trough decline since 2011. What immediately stands out is not just how brutal past bear markets were, but how consistently Bitcoin has tested investor conviction before resetting for the next cycle. Compared to earlier crashes, today’s pullback still sits on the shallow end of Bitcoin’s historical spectrum.
The pink area on the chart tracks Bitcoin’s percentage drawdown from its all-time high, overlaid with the BTC price itself. Previous cycle lows were extreme: roughly -93% in 2011, -85% in 2015, -84% in 2018, and -77% in 2022. In contrast, the current cycle is hovering near a -50% drawdown, which is materially less severe than any prior major bottom. From a purely historical standpoint, that suggests Bitcoin has not yet experienced the type of capitulation that has defined past cycle lows.
Crypto Patel’s key observation is valid: each cycle’s maximum drawdown has become less aggressive over time. That trend aligns with Bitcoin’s maturation, deeper liquidity, broader ownership, and increasing institutional participation. However, the chart also delivers an uncomfortable reality check. Even if this cycle continues the pattern of “shallower” losses, a move toward a -70% drawdown would still be well within historical norms, and that would place Bitcoin near the $30,000 zone from current levels.
The most important takeaway is not a price prediction, but a framework. Bitcoin does not bottom quietly. Every prior cycle required prolonged pain, time, and psychological exhaustion before a durable low formed. The absence of a deep drawdown does not invalidate the bull thesis long-term, but it does indicate that downside scenarios remain very much alive. Markets rarely reward complacency, especially during transitions between expansion and contraction phases.
Crypto Patel’s conclusion is less about fear and more about preparation. History shows that Bitcoin survives every storm, but not everyone holding it does. Planning for multiple outcomes, including deeper volatility, has historically been the difference between forced exits and long-term survival. If this cycle ultimately bottoms at a higher level than the past, that will be constructive. Until proven otherwise, though, the chart argues for respect (not confidence) in what Bitcoin is still capable of doing on the downside.
Read also: Robert Kiyosaki Buys Another Bitcoin at $67,000 as BTC Price Shows Recovery Signs
Subscribe to our YouTube channel for daily crypto updates, market insights, and expert analysis.