Bitcoin price action has started to feel uncomfortable again, especially when placed side by side with gold and silver. While precious metals continue to grind higher, BTC price has pulled back and now sits at a level that raises bigger questions about relative strength, timing, and what usually comes next when these markets diverge this clearly.
The charts shared alongside this discussion tell a deeper story that goes beyond short-term volatility and points toward a possible shift that may already be taking shape.
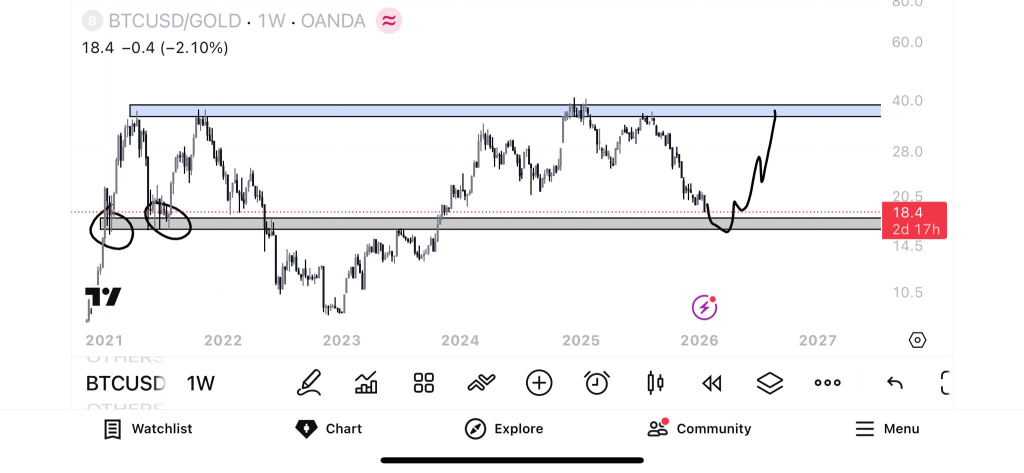
Bitcoin price has slipped back toward the high $80K region while gold and silver continue pressing higher, reinforcing the idea that capital has recently favored traditional safe havens. This divergence becomes even clearer on the BTC against gold chart, where Bitcoin has retraced into a long tested support zone that has held since 2021.
Chetan highlights this structure clearly, noting that BTC against gold is approaching the 17.6 to 16.3 range, an area that has repeatedly acted as a base for reversals over the past several years. That context matters because relative charts often turn before absolute price charts do, especially when broader macro conditions start to shift.
What you'll learn 👉
BTC Accumulation Trends Suggest A Different Story Beneath The Surface
Santiment adds an important layer to the Bitcoin price discussion by looking beyond candles and focusing on behavior. Data shows that wallets holding between 10 and 10K BTC have accumulated over 36,000 BTC in just 9 days, even as smaller holders reduced exposure slightly.
This pattern has appeared before during periods of BTC price weakness, particularly when confidence among short-term participants fades. The accumulation trend suggests that longer-term holders may be positioning quietly while attention remains fixed on gold’s strength and Bitcoin’s pullback.
📊 Bitcoin's price has fallen back down to $89.4K as gold & silver continue to surge. That said, Bitcoin's whales & sharks continue to accumulate.
— Santiment (@santimentfeed) January 20, 2026
🐳 Wallets with 10-10K $BTC: Accumulated +36,322 tokens in the past 9 days (+0.27%)
🦐 Wallets with under 0.01 $BTC: Dumped -132… pic.twitter.com/RnVOgVl3j2
Bitcoin Oversold Conditions Contrast With Gold’s Overbought Setup
Crypto Fergani points to a classic relative condition that tends to appear near turning points. Bitcoin is oversold while gold is overbought, a combination that historically does not last very long. Markets often rotate rather than move in straight lines, especially when sentiment becomes one sided.
When gold momentum stretches too far, and BTC price reaches compressed levels, the setup often favors a reversion, even if the timing remains uncertain.
Midas takes the comparison a step further by overlaying Bitcoin’s recent structure with gold’s pre-parabolic phase from the 1970s. The visual similarity between gold’s long consolidation near prior highs and Bitcoin’s current multi-year structure is difficult to ignore.
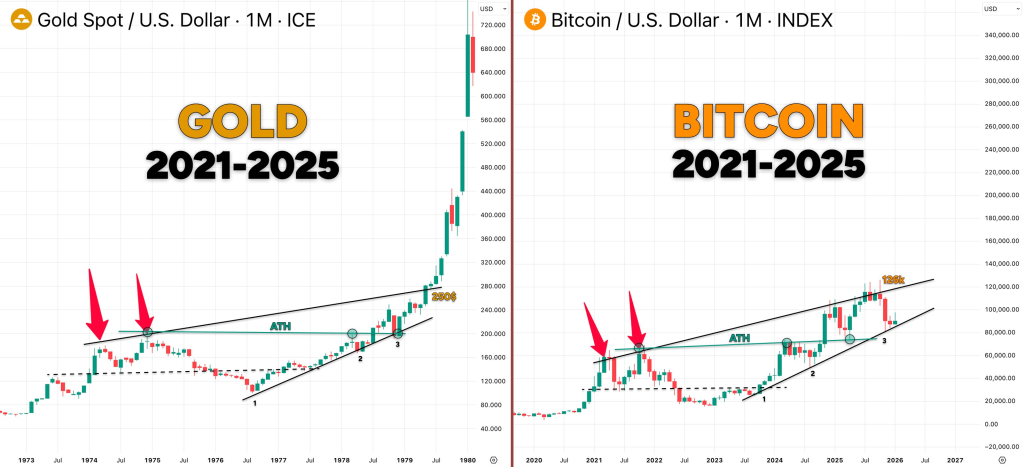
The comparison does not suggest identical outcomes, but it highlights how prolonged consolidation near previous peaks can act as a base rather than a ceiling. Gold spent years frustrating participants before entering its strongest phase, and Bitcoin appears to be moving through a comparable compression period between 2021 and 2025.
BTC Price At A Crossroads That Could Redefine The Trend
Bitcoin price weakening while gold and silver push higher may feel discouraging in the moment, yet history suggests these periods often precede meaningful rotations. The combination of long-term support, accumulation by larger holders, oversold conditions, and historical comparisons keeps the bigger picture very much alive.
Read Also: Gold Just Hit a New All-Time High: Does Bitcoin (BTC) Price Follow Next?
Whether Bitcoin flips the script soon or continues to test patience, the current setup is one that rarely stays unresolved for long, making the coming months especially interesting to watch.
Subscribe to our YouTube channel for daily crypto updates, market insights, and expert analysis.