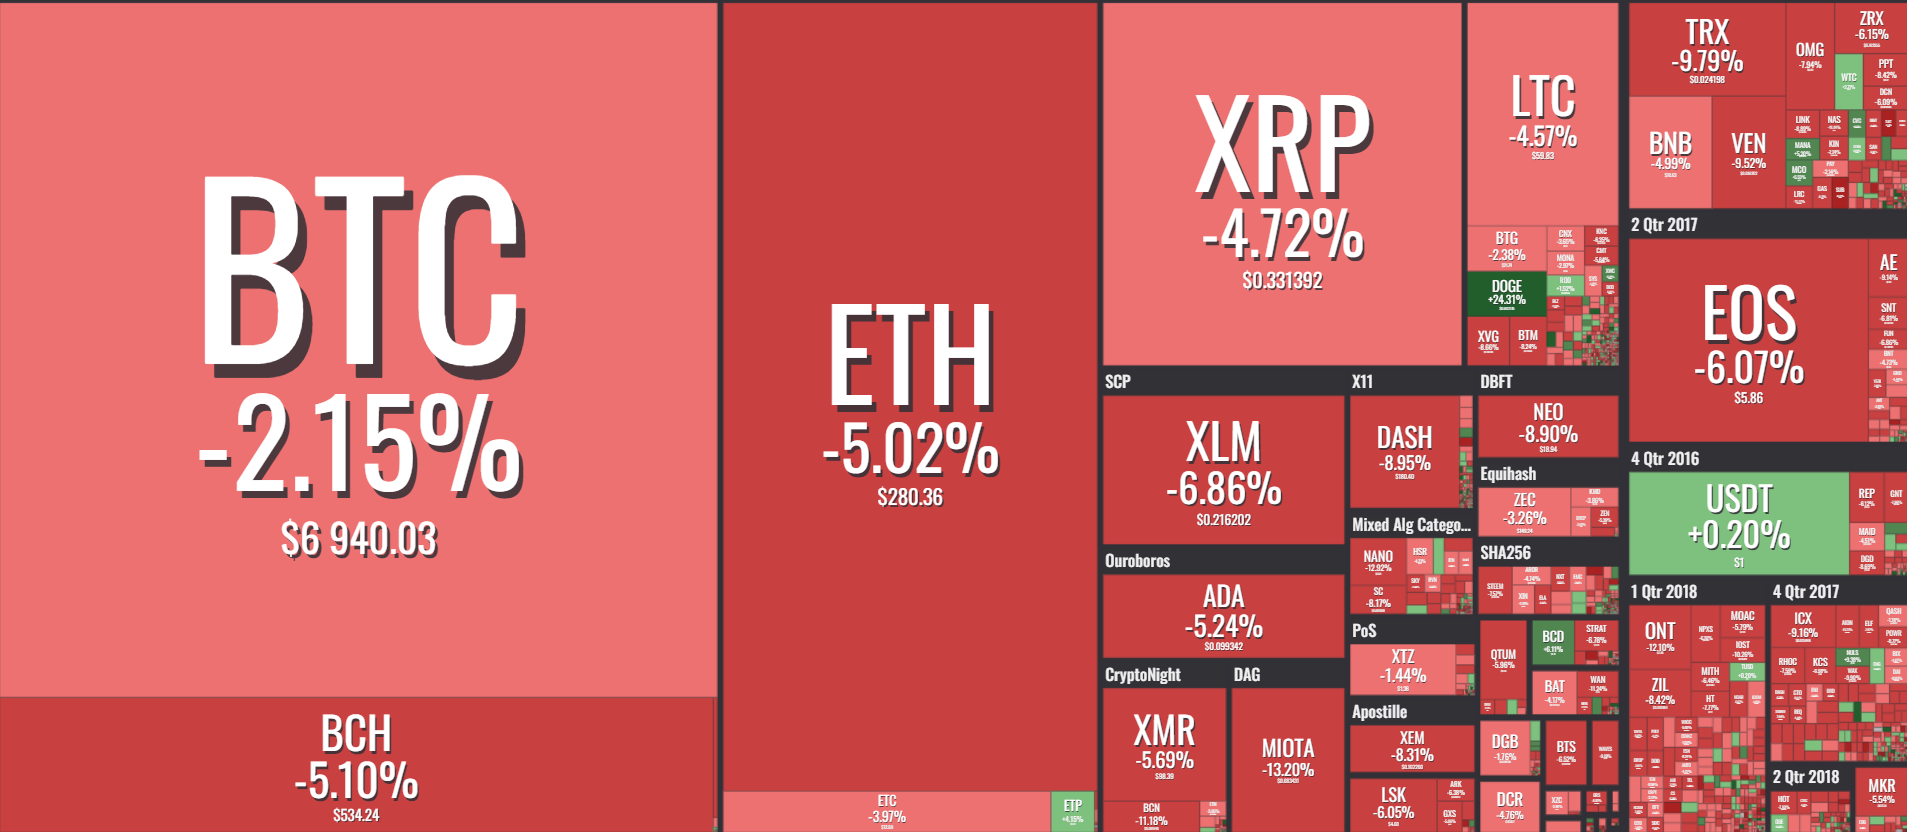
The retracement is in full swing. Bitcoin went below $7000 again and alts are starting to record decent pullbacks. Overall, technicals have indicated this outcome is more than plausible and we are seeing it unfold as predicted. Most people felt that this type of correction is required to establish a strong support for the ascending channel that Bitcoin is trying to create. Again, we looked at several traders to see what they think of the market:
Bitcoin (BTC)
A lot of conflicting opinions here right now. SuperForex represented the general sentiment:
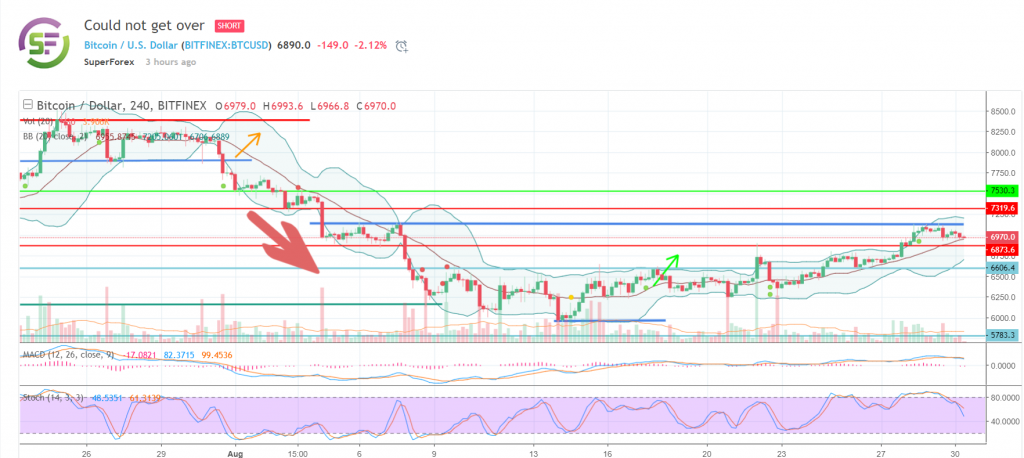
“The price could not overcome the level of 7.100 and moved away from this level. At the moment, technical indicators point to a sale and the price is approaching the middle of Bollinger Bands. We believe that in case of transition to the lower zone, the price will continue the downward movement.
Support levels remain the same and even in the case of further growth, the current correction should be implemented. Therefore, we advise you to look for points to enter short positions with points for exit at the support levels of 6.600 – 6.800.”
@ToneVays from Twitter had this to say about Bitcoin:
“I give it a higher than 50% percent chance that we probably are (headed back to $6000 and lower).
1W TF: “We’re seeing some weakness; it’s still too early to say if Bitcoin will make it all the way to $7500.”
1D TF: I’m looking for potential of two more days of upside.
12H TH: This price action is not good. You’re sitting at a MA so until Bitcoin gets down below $6925, there’s not that much to worry about.”
@CryptoSays added the following:
I'm about to be very bullish in the next couple days. Let's see how this pans out. $BTC Looking at the $6700 area very closely.
— Mitoshi Kaku ??? (@CryptoSays) August 29, 2018
Finally, BCryptological adds one crucial signal to keep an eye on in the upcoming days:
“The Stochastic RSI is a very powerful indicator of momentum in the market, and on the daily Bítcoin chart it is clearly showing that the bulls have likely run out of momentum. This is backed up by the low volumes the bulls are offering as they struggle to pass the strong $7120 historical resistance level , plus a Relative Strength Index which had been rapidly approaching oversold territory.
When the Stochastic RSI crosses down over the 80 line after a strong bullish period, it usually always confirms a period of substantial selling is underway.”
Ethereum (ETH)
Trader easyMarkets thinks ETH could go long, but the support line he has drawn up seems to be close to breaking:
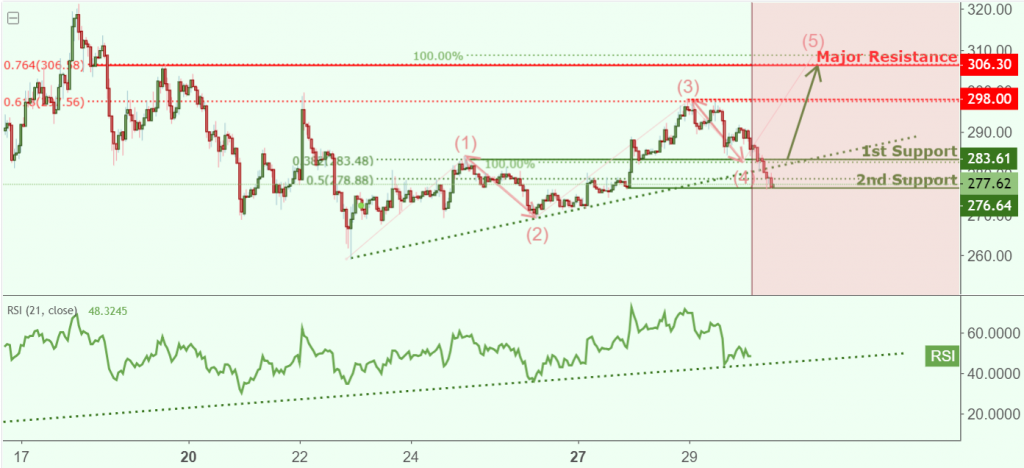
“ETHUSD is approaching our support at 283 (horizontal pullback support, 100% Fibonacci extension, 38.2% Fibonacci retracement, short term ascending support line) and a strong bounce might occur above this level pushing price up to our major resistance at 306 (horizontal overlap resistance, 100% Fibonacci extension, Elliot wave structure, 76.4% Fibonacci retracement).
RSI (21) is approaching support where a bounce above this level might see a corresponding rise in price.”
CryptoComes highlighted what ETH needs to do next to stay afloat:
“If the price structure wants to stay healthy then the pullback can’t be lower than $270-$275. Why? At the moment we have a nice HL at $270 level but if we drop below that then we make a new lower low and also we have a close below the strong support (blue line) which all indicates bearishness. In the image, You can also see bearish confirmation box, at least 4h candle close in this area could be a disaster for ETH and we may go to around $200.
If we stay ‘healthy’ and we got a bounce around $270-$275 (bounce is supported by – strong support level and Fibonacci 62% retracement level) then we have made a new HL (higher low) and we are ready to climb higher. First obstacles are the triangle trend line and the round number which is $300. To be fully confirmed that we start to heading upwards we have to make a new higher high which is around $330-$340.”
Check out the complete analysis here as it contains the chart and information about some bearish patterns the trader notices.
Finally, @PeterLBrandt from Twitter posted his own not so bullish outlook:
I do not short cryptos, but if I did $ETHUSD would be high on my list if the daily chart pennant is completed. pic.twitter.com/vIbtZJze54
— Peter Brandt (@PeterLBrandt) August 30, 2018
Ripple (XRP)
Fanatik_ thinks XRP might be looking to break out soon:
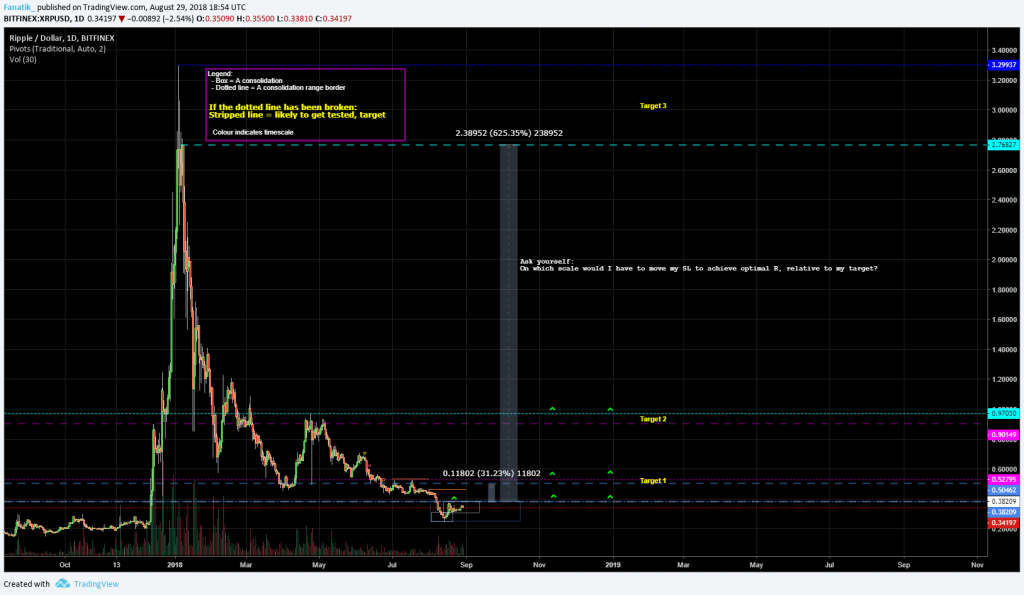
“As a Break-out trader, this would be my setup. Pyramid trade, highest addition to my position would be after target 1 got broken. Manual “SL” would be moved up as price goes up.”
Other thoughts
As mentioned before, the correction has clearly begun, and several alts have gone down more than 10% in the last 24 hours. Nano (15%), IOTA (13%), Ontology (13%) and Loopring (12.77%) are the ones that have suffered the most. Meanwhile, the well-known value keeper Dogecoin is weathering this short storm better than anybody else, recording a rise of 14.82% during the last day. It would probably be best if you hold onto any position you took in the previous week or so, as we are still unclear if this move will bounce upwards or break through the current supports. We should know more once September rolls around.


