
Bitcoin had a strong start to 2026. The initial days were filled with supportive market actions such as stable price movements, good demand in the spot markets, and no indication of panic selling.
After a robust performance for the year 2025, it did appear as though the market was taking a breather. Volatility had reduced, with a relaxed mood present within the world of cryptocurrency.
That’s why a recent warning from trader Chiefy caught so much attention. In a tweet that quickly made the rounds, he indicated Bitcoin already topped near $126,000 and is now stuck in what he calls a classic bull trap.
In his view, that trap could eventually unwind into a brutal move lower, with the BTC price sliding all the way toward $30,000. It’s an eye-catching call, and one that’s worth breaking down.
What you'll learn 👉
What the BTC Chart Is Pointing To
The chart behind this claim leans on a familiar market pattern. After a strong rally, price pushes to new highs, fails to hold them, and then rolls over, trapping late buyers along the way.
Chiefy’s argument is that the move above $120,000 was that final push, designed to pull in optimism right before the trend turns.
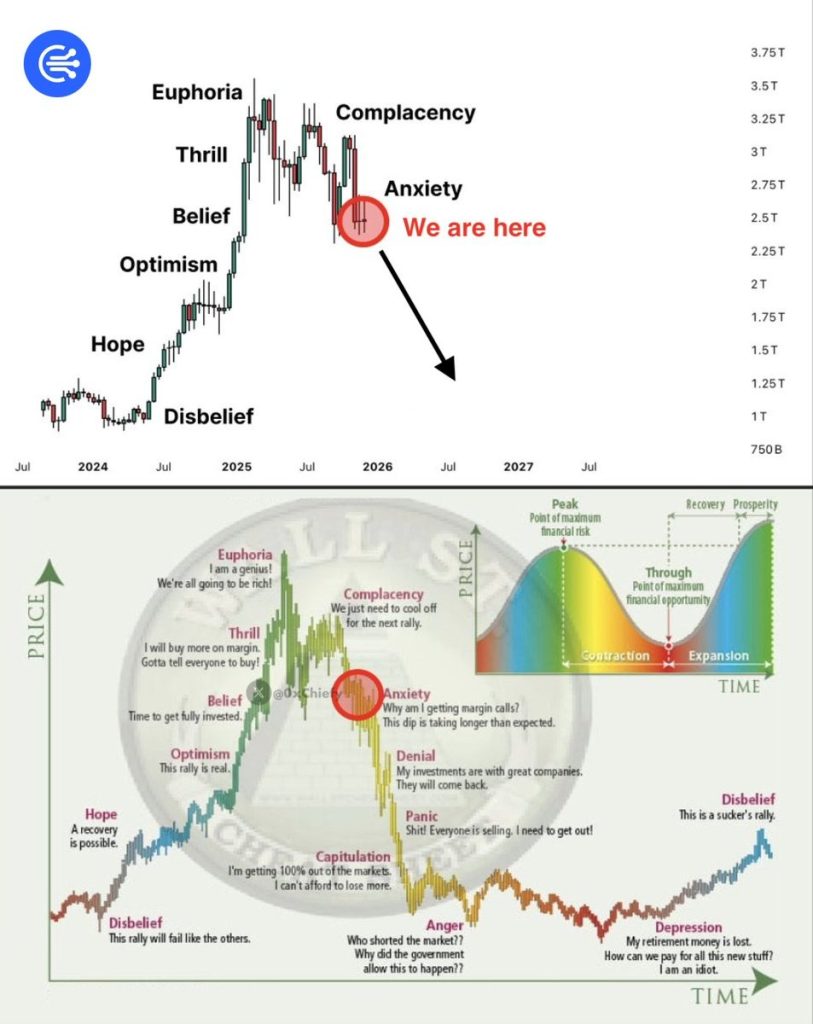
On his chart, Bitcoin starts to lose structure as former support flips into resistance. Momentum indicators turn down, and price begins forming lower highs on higher timeframes.
From that perspective, once key support levels give way, the door opens to a much deeper correction. The $30,000 level is highlighted as a long-term target, based on how previous cycles have unwound and how deep Bitcoin drawdowns have been in the past.
History does show that Bitcoin can fall hard once momentum breaks. In earlier cycles, 60% to 80% drawdowns weren’t unusual, even during long-term bull markets.
Read also: Why Trump Moved on Venezuela and What It Could Mean for Bitcoin and Crypto
How Likely Is a Drop to $30K?
This is where reality checks come in. A move from current levels down to $30,000 would mean a collapse of more than 70%. While nothing is impossible in crypto, that kind of drop usually needs a serious trigger. Think global liquidity shocks, major macro breakdowns, or aggressive regulatory events that fundamentally change how capital flows into Bitcoin.
Right now, the data doesn’t really support that scenario. On-chain metrics don’t show panic selling or heavy distribution. Long-term holders aren’t rushing for exits, and exchange balances aren’t spiking the way they typically do before major crashes.
On top of that, Bitcoin’s market structure is very different than it was in earlier cycles, with much deeper institutional involvement acting as a stabilizing force.
From a technical standpoint, Bitcoin would have to break through several layers of support before a $30K target even comes into focus. That would require sustained weakness, not just a rejection from recent highs.
What’s Next for BTC?
Charts like this have their place. They remind traders to manage risk and not get carried away by bullish narratives. But a straight-line crash to $30,000 from here feels more like an extreme scenario than a likely outcome.
A healthy correction is always possible, especially after a strong run. But calling for a full collapse at this stage ignores a lot of structural support and current market behavior.
For now, Bitcoin appears to be more a market that is consolidating and processing its gains rather than one that is poised for a historical wipeout. This type of warning is something that is worth keeping in mind, rather than something to base predictions off of.
Subscribe to our YouTube channel for daily crypto updates, market insights, and expert analysis.