Bitcoin has just been through a savage run. It went up past $100,000 in late 2025, and then it’s been on a long, painful correction. The decline hurts, but to anyone paying even the slightest bit of attention to market cycles, it’s been almost white-noise predictable. Now, a rarely discussed indicator is flashing a signal that has marked every major cycle bottom in Bitcoin’s history.
CryptoCon shared this analysis on X, pointing to the Weekly RSI of Bitcoin’s Realized Market Cap. This metric tells a similar story to better-known indicators like Puell Multiple and MVRV. The BTC price is close to cycle bottom levels, though slightly off.
What you'll learn 👉
Understanding the Realized Market Cap RSI
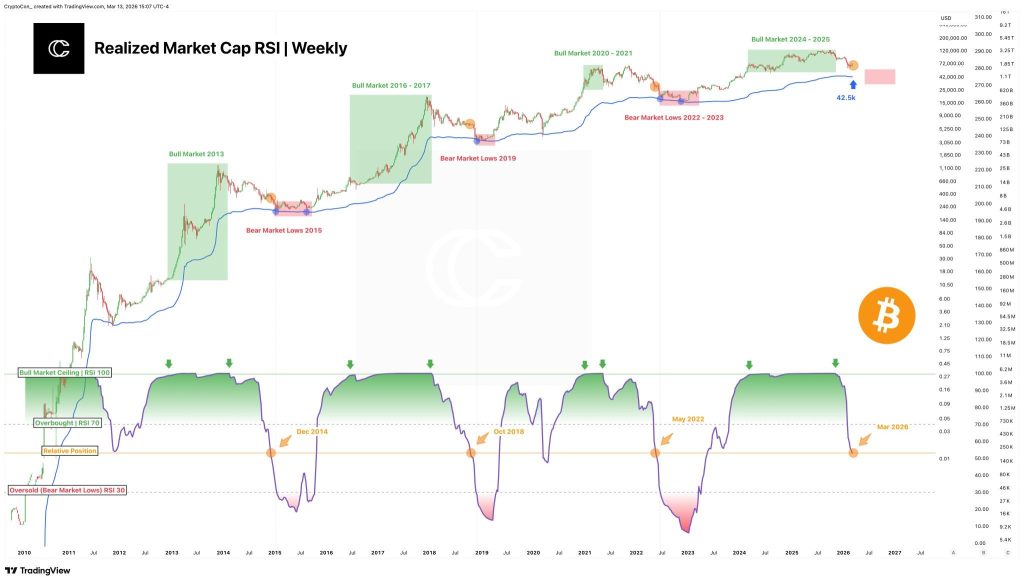
The realized market cap differs from standard market cap by valuing each Bitcoin at the price it last moved, not the current spot price. This gives a clearer picture of aggregate cost basis across all holders. Applying RSI to this metric on the weekly timeframe reveals when the market is at extreme levels of fear and capitulation.
The chart shows this indicator tracing clear cycles since 2010. Each time the weekly RSI of realized market cap has touched certain levels, the BTC price has been at or near a major cycle bottom. The pattern is remarkably consistent across more than a decade of market history.
The current reading shows the indicator approaching these historic bottom zones but not quite there yet. This aligns with the broader market picture, where the BTC price has stabilized but not yet shown the kind of explosive reversal that typically follows final capitulation.
The Target Level That Matters for Bitcoin
CryptoCon identifies a specific price level where the realized market cap moving average suggests the bottom could form. That level is $42,500, and it is decreasing slightly over time. This represents a potential downside target if the BTC price continues its correction before finding final support.
The significance of this level comes from its track record. The realized market cap moving average has caught every cycle bottom precisely, from the 2011 lows through the 2015, 2018, and 2022 bottoms. Each time the BTC price touched this moving average, it marked the end of the bear market.
A move to $42,500 from current levels near $68,000 would represent roughly a 38% decline, a drop that would fit the historical pattern of bear market depths.
Where We Are in the Cycle
The current reading shows the BTC price close to cycle bottom levels but slightly off. This suggests either the bottom is near and price will drift lower to meet the moving average, or the moving average will decrease over time and meet price at current levels.
The RSI of realized market cap is not yet at the extreme lows seen at previous cycle bottoms. There is room for further downside before reaching the levels that marked the 2018 and 2022 capitulation events.
Read Also: Kaspa (KAS) Leads Bitcoin, Monero, and Others as Favorite Proof Of Work Crypto
What This Means for the BTC Price
For traders, the main focus will be on the price level of $42,500, which could be an area to accumulate. If the price of BTC goes lower than this, it could be entering an area that has traditionally marked the end of bear markets.
The BTC price currently sits well above this level. The indicator is close but not there. The coming weeks will determine whether price drifts lower or time catches up. For now, the signal is worth watching. The realized market cap RSI has called every major bottom in Bitcoin’s history. It is now flashing that same setup again.
Subscribe to our YouTube channel for daily crypto updates, market insights, and expert analysis.