Let’s break down the insightful analysis provided by Ali (@ali_charts), a top-notch analyst and well-known trader in the cryptocurrency space.
What you'll learn 👉
Ali’s Analysis on Bitcoin’s 3-Day Chart
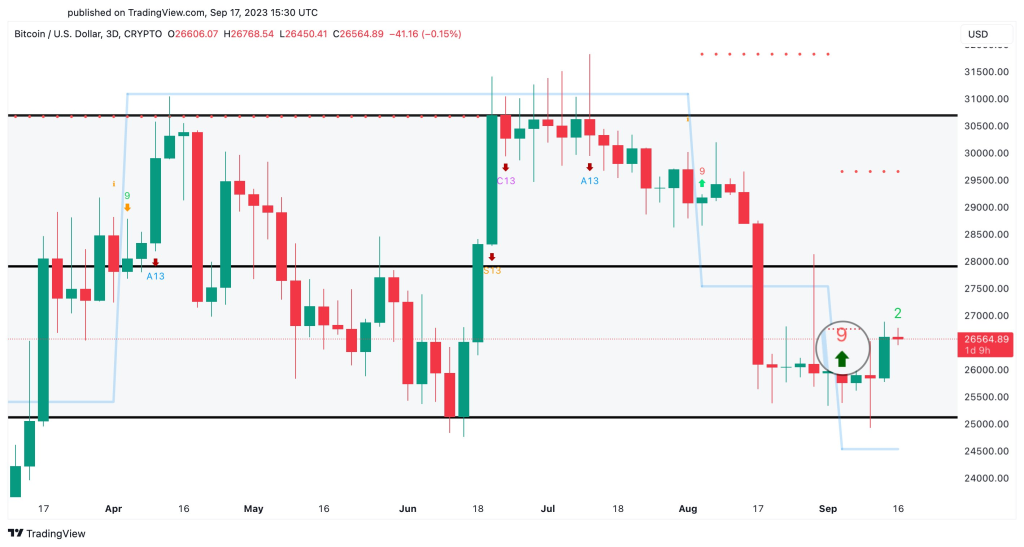
Ali points out that the 3-day chart for Bitcoin (#BTC) is showing a buy signal according to the TD Sequential indicator. This is a technical analysis tool used to identify the timing of market entries and exits. When this indicator flashes a buy signal, it often suggests that the asset is in a favorable position for a price increase.
Price Targets
Ali suggests that if buying pressure for Bitcoin increases, the price could potentially move towards the mid or upper boundary of its current trading channel.

Specifically, Ali targets the price levels of $28,000 and $31,000. These targets are based on technical patterns and are areas where traders might expect some level of resistance or profit-taking.
What is the TD Risk Line?
The TD Risk Line is a crucial part of the TD Sequential indicator, serving as a key invalidation point. In simpler terms, it’s a price level that, if crossed, would negate the buy or sell signal given by the TD Sequential.
For Bitcoin, Ali identifies this level as $24,500. If the price of Bitcoin falls below this point, the buy signal would be invalidated, and traders might consider it a sign to exit their positions or refrain from entering new ones.
In summary, Ali’s analysis suggests a bullish outlook for Bitcoin with specific price targets, but also advises caution by keeping an eye on the TD Risk Line at $24,500. As always, it’s essential for traders to do their own research and consider various risk factors before making any investment decisions.
We recommend eToro
Wide range of assets: cryptocurrencies alongside other investment products such as stocks and ETFs.
Copy trading: allows users to copy the trades of leading traders, for free.
User-friendly: eToro’s web-based platform and mobile app are user-friendly and easy to navigate.


