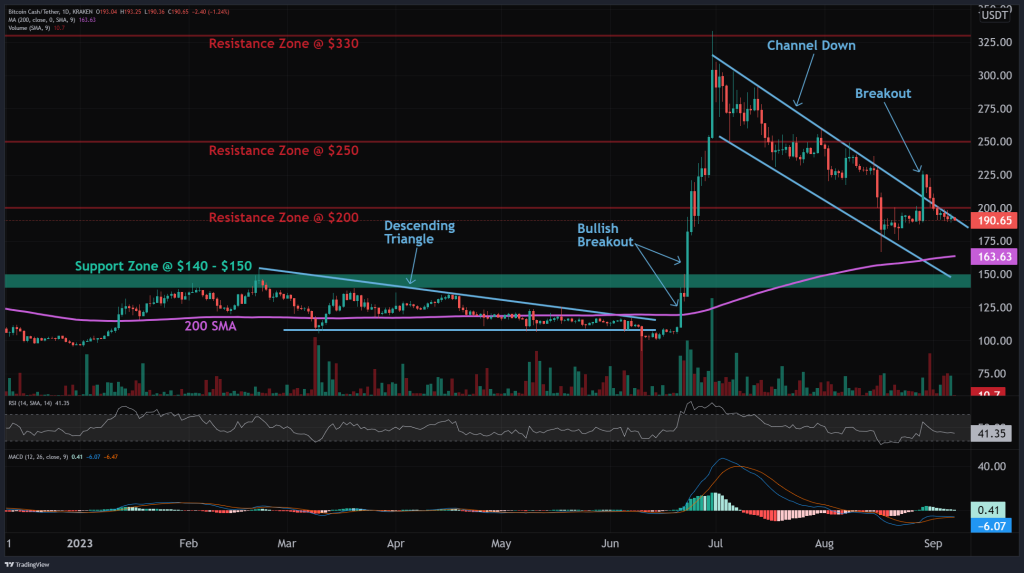
Bitcoin Cash (BCH), a cryptocurrency that emerged as a fork of Bitcoin, is currently experiencing significant market volatility. This article delves into the intricate details of BCH’s recent price movements, patterns, and trends, offering a comprehensive analysis for traders and investors alike.
What you'll learn 👉
The Bullish Breakout: A Signal for Uptrend Resumption?
Bitcoin Cash recently showcased a bullish breakout from a Channel Down pattern, a technical formation that had been dictating its price movement for some time.
The coin is now retesting this breakout level. Should it successfully move back above the $200 mark, it would serve as a confirmation of this breakout. In the near term, this could propel the coin towards a $250 target, and in the long term, possibly up to $330.

Source: altFINS – Start using it today
Historical Context
It’s worth noting that BCH had previously surged by over 200%, climbing from $100 to meet resistance at $330. This rapid ascent led to overbought conditions, indicated by an RSI (Relative Strength Index) exceeding 70. Traders began to take profits, exerting selling pressure on the coin.
This led to BCH entering a Channel Down pattern, where it relinquished most of its gains. Interestingly, the initial rally was catalyzed by the launch of a new cryptocurrency exchange, EDX, which listed BCH along with other major cryptocurrencies like BTC, ETH, and LTC.
Trading Patterns: The Channel Down
In technical analysis, a Channel Down pattern is a bearish formation. However, a breakout from this pattern can signal a potential reversal. Traders often initiate positions when the price breaks through the channel’s trendlines, either upwards or downwards.
Such breakouts can result in rapid price movements in the direction of the breakout, offering lucrative trading opportunities.
Doge2014 raises 500K in days celebrating Dogecoin. Make potentially big profits and get in on exclusive airdrop!
Show more +Market Trends: A Mixed Bag
While BCH has been in a downtrend on a short- and medium-term basis, it shows signs of an uptrend in the long term. The momentum indicators present a mixed picture:
- MACD Line: Above the MACD Signal Line, indicating bullish momentum.
- RSI: Below 45, suggesting bearish conditions.
- MACD Histogram: Bars are declining, hinting at weakening momentum.
Support and Resistance Levels: Key Zones to Watch
For traders looking to enter or exit positions, the following are the key support and resistance zones:
- Support Zone: $140 – $150
- Resistance Zones: $200, followed by $250 and the critical level at $330.
We recommend eToro
Wide range of assets: cryptocurrencies alongside other investment products such as stocks and ETFs.
Copy trading: allows users to copy the trades of leading traders, for free.
User-friendly: eToro’s web-based platform and mobile app are user-friendly and easy to navigate.


